 English
  Русский
 Bahasa Indonesia
 Bahasa Malay
 ไทย
ไทย Español
 Deutsch
 Български
 Français
 Tiếng Việt
 中文
中文 বাংলা
বাংলা हिन्दी
 Čeština
 Українська
 Română

Crypto Industry News:
Meta, the parent company of Facebook and Instagram, has announced another expansion in its digital arts initiative. From September 29, all users of both platforms can combine wallets and share NFT tokens in 100 countries.
As part of the feature, which is being tested since May, users will be able to tag creators and collectors, as well as transfer digital collectibles between platforms at no cost.
In August, Meta began allowing users to publish their digital collectors' items on Facebook and Instagram, and announced its international expansion to countries in Africa, Asia-Pacific, the Middle East and the Americas.
The company also added support for third-party wallets such as Rainbow, MetaMask, Trust Wallet, Coinbase Wallet, and Dapper Wallet, as well as support for Ethereum, Polygon, and Flow Blockchain chains.
Several Twitter users at the time expressed concern about the security and privacy of data sent by linking digital wallets to the Meta platform. In April 2021, confidential personal data of more than half a billion Facebook users was leaked on a frequently visited hacking forum.
According to Statista data, Facebook and Instagram have 2.9 billion and 1.4 billion monthly active users, respectively.
Technical Market Outlook:
The ETH/USD pair has been moving lower over the weekend and is currently tradin g just above the demand zone. Nevertheless, the next target for bears is seen at the level of $1,100, $1,000 and $990, which means the low from 22th September located at $1,220 should be broken as the down trend will continue. The intraday technical support is seen at the level of $1,281, $1,267 and $1,255 and the technical resistance is located at $1,358 and $1,407.
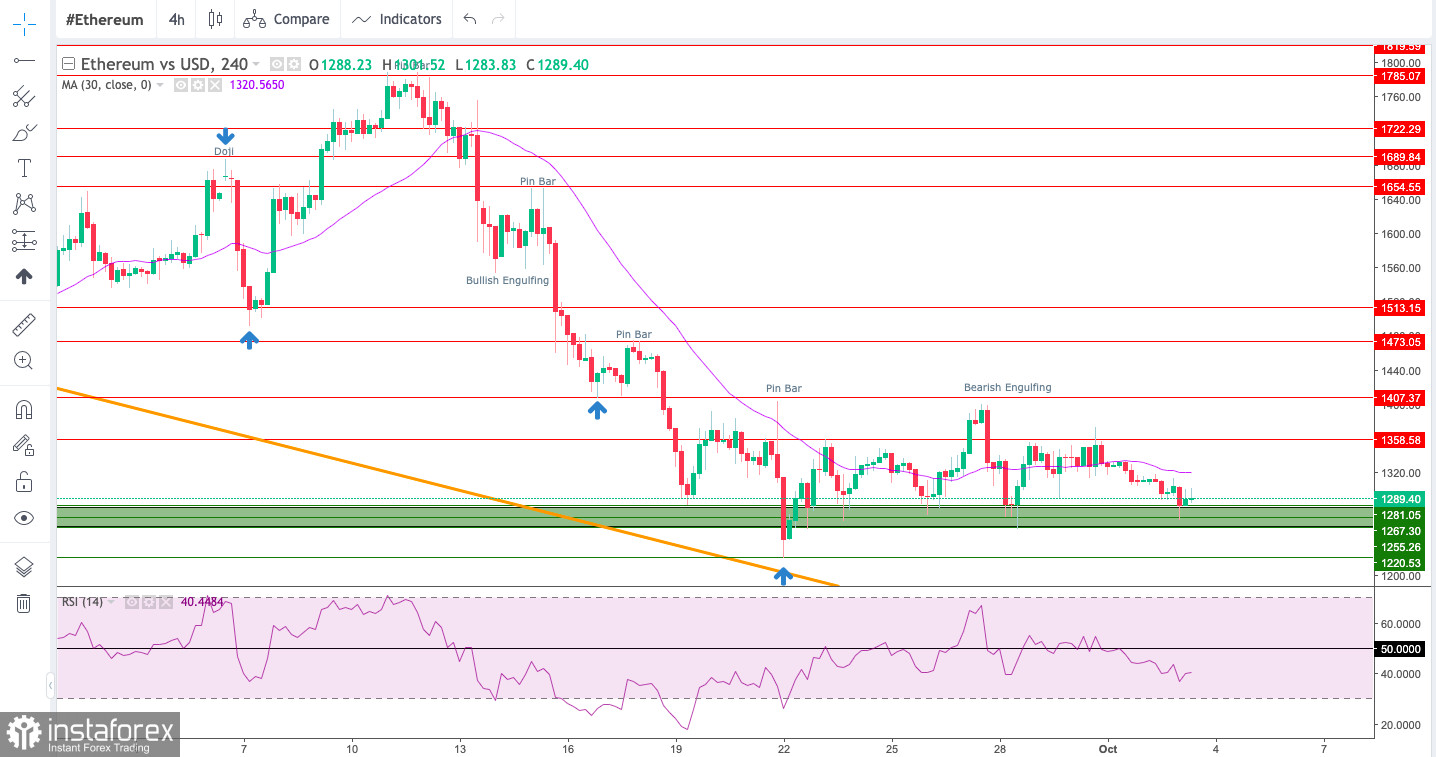
Weekly Pivot Points:
WR3 - $1,360
WR2 - $1,320
WR1 - $1,306
Weekly Pivot - $1,283
WS1 - $1,268
WS2 - $1,245
WS3 - $1,206
Trading Outlook:
The Ethereum market has been seen making lower highs and lower low since the swing high was made in the middle of the August at the level of $2,029. The key technical support for bulls is seen at $1,281 as a part of the demand zone located between the levels of $1,252 - $1,295. If the down move will be extended, then the next target for bears is located at the level of $1,000.