 English
  Русский
 Bahasa Indonesia
 Bahasa Malay
 ไทย
ไทย Español
 Deutsch
 Български
 Français
 Tiếng Việt
 中文
中文 বাংলা
বাংলা हिन्दी
 Čeština
 Українська
 Română

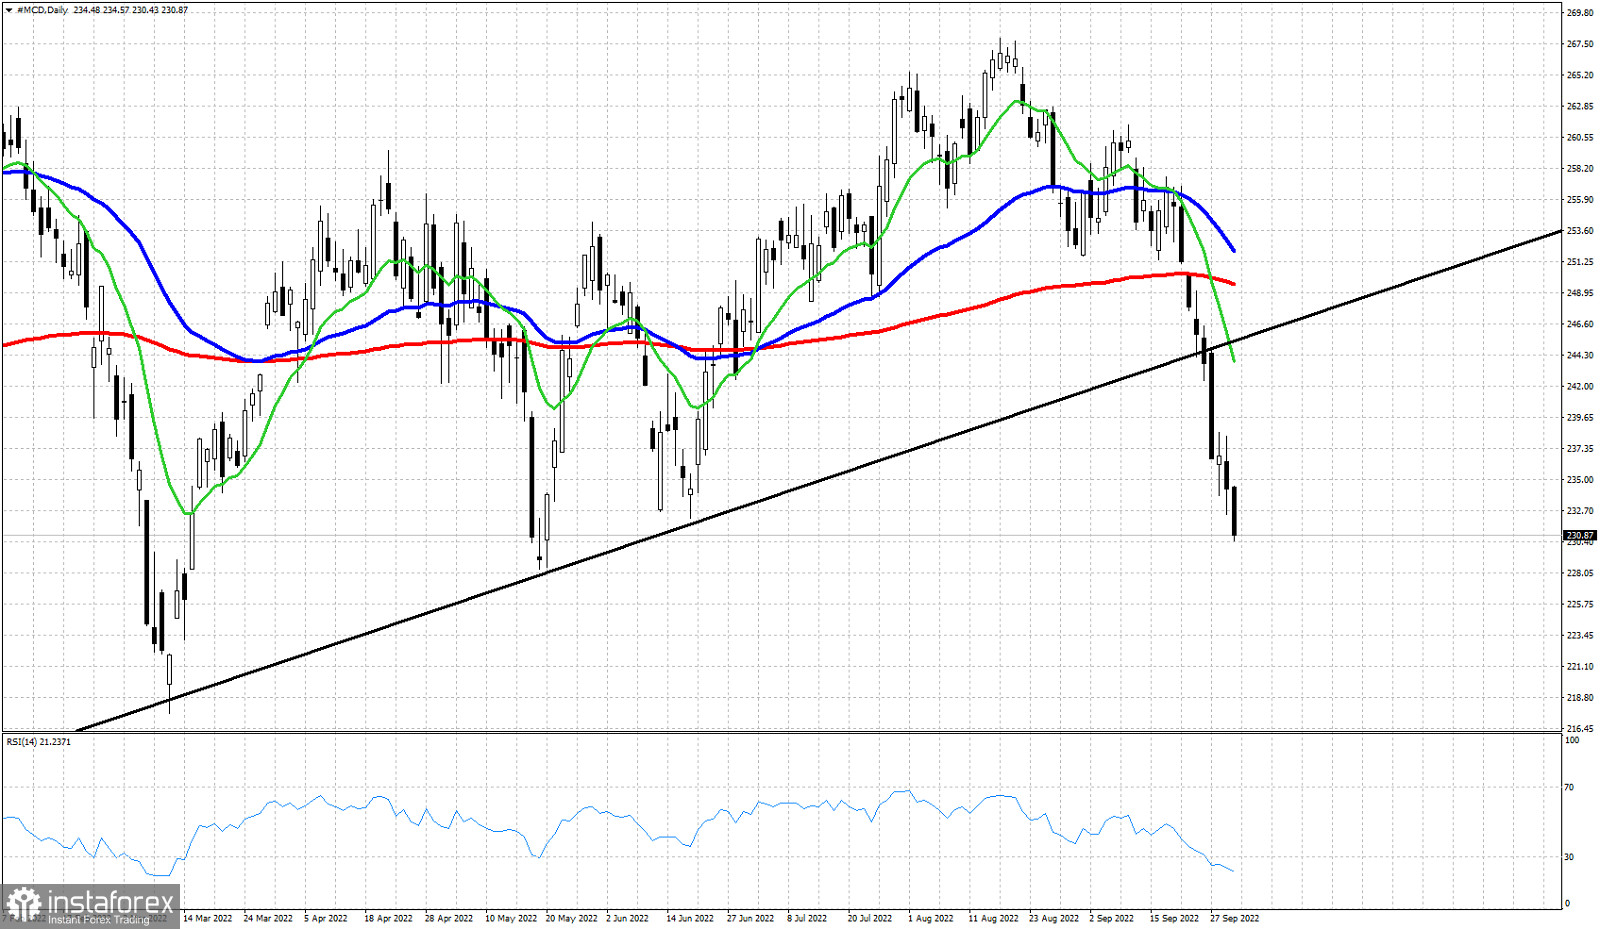
Black line- support trend line
Red line- 200 Exponential MA
Blue line- 50 Exponential MA
Green line - 13 Exponential MAMCD closed last week around $230, 15$ lower than when we first mentioned the bearish signals we were getting. In our previous post we warned traders that by breaking below the black upward sloping trend line we were getting a bearish confirmation. Our first warnings came with price breaking below the 13 day, 50day and 200 day EMA. The negative slope of the EMA indicators and the crossing of the 13 day EMA below the 50 and 200 day EMA also was a bearish sign. Last week ended with price around $230 and the RSI at oversold levels. Our short-term target is at $200 and although we could see some short-term bounces, we believe that the main corrective trend will eventually push price towards that price area. As long as price is below $255 this is our primary scenario.