 English
  Русский
 Bahasa Indonesia
 Bahasa Malay
 ไทย
ไทย Español
 Deutsch
 Български
 Français
 Tiếng Việt
 中文
中文 বাংলা
বাংলা हिन्दी
 Čeština
 Українська
 Română

Conditions to open long positions on EUR/USD
Buyers of the euro decided to take a risk and succeeded. Let us take a look at the 5-minute chart and find the entry points. In the morning, I recommended to focus on the level of 1.1234 and enter the market at this level. A breakout and consolidation above this level and a following drop formed a perfect entry point for bulls. As a result, the euro jumped to the next resistance level of 1.1273. A false breakout of this level allowed sellers to enter the market. As a result, the euro lost 30 pips. From the technical point of view, the changes are quite significant.
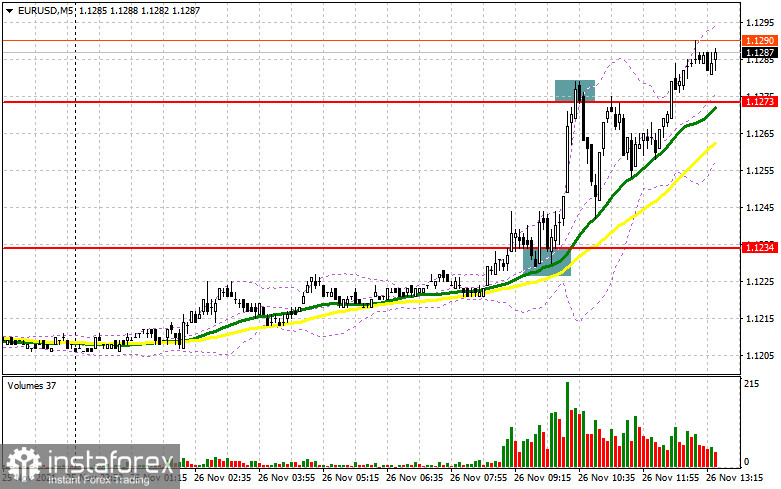
In the second part of the day, there will be no important macroeconomic reports. In addition, the US trading session will be shortened today, thus causing a lower volatility. Buyers will try to protect the support level of 1.1260. Although the euro surged, the main trend remains downward. That is why a false breakout of 1.1260 will provide traders with a new buy signal. In this case, the price may hit 1.1317.
A breakout of the level will also be an important task for bulls. A downward break of 1.1317 will provide traders with a perfect entry point to push the pair higher to 1.1359 and 1.1417, where it is recommended to lock in profit. If the euro/dollar pair declines to 1.1260, it is better to wait until it slides deeper and makes a false break of the low of 1.1213, where there are bullish moving averages. It is possible to open long positions from 1.1188 or 1.1155 with the target located 15-20 pips higher.
Conditions to open short positions on EUR/USD
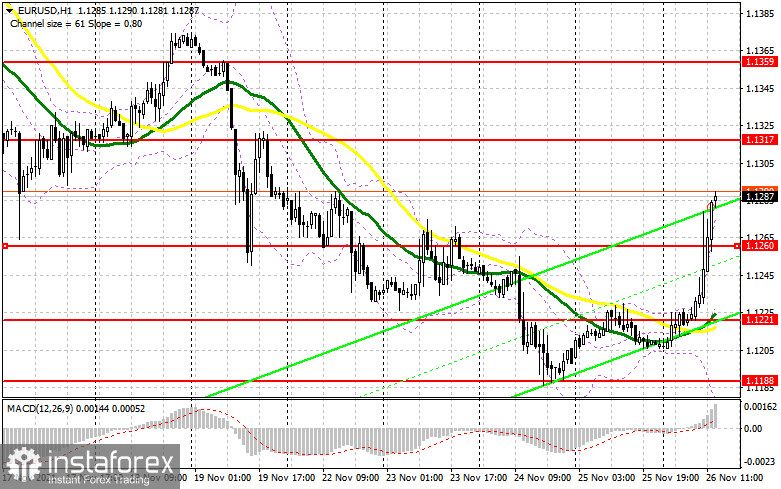
It will be possible to open short positions, if the price forms a false breakout near the new resistance level of 1.1317. In this case, bears will try to break and fix below 1.1260.
If the price upwardly breaks this level, traders will get a sell signal with the target of 1.1221. The pair will hardly decline below this level today. The next target is located at 1.1188, this week's low. It is recommended to lock in profit at the mentioned level.
Traders should also keep in mind that today most exchanges have a shortened day. That is why lower market volatility will influence the volume of positions. Thus, buyers have a chance to keep control over the market. It is better not to open sell positions, if the price rises and bears' activity remains tepid at 1.1317. Traders may open short positions after a false breakout of 1.1359. It is possible to open sell positions from 1.1417 with the target located 15-20 pips lower.
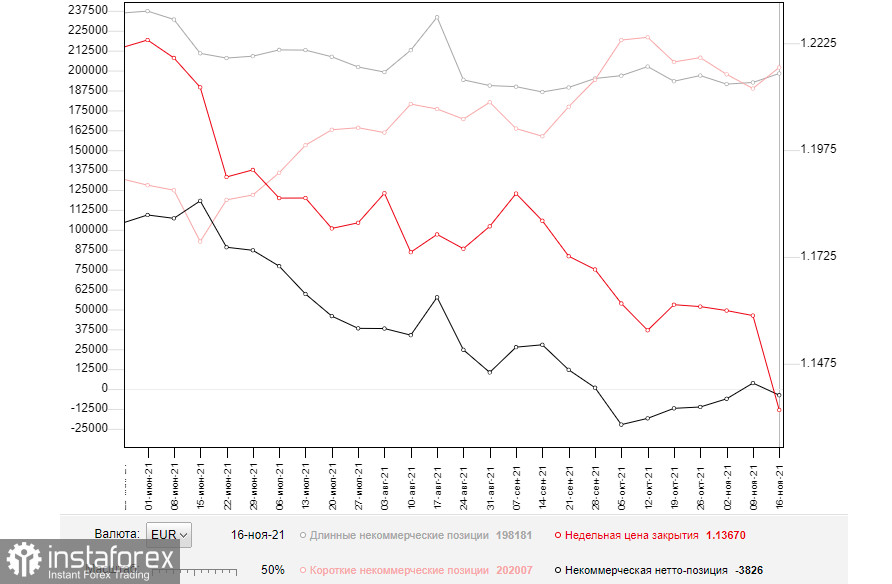
According to the COT report (Commitment of Traders) from November 16, both short and long positions increased. However, the number of short positions exceeded the number of long ones. The risk of another surge in the number of new virus cases and lockdowns in some EU countries is again putting pressure on the euro. The currency is still recovering from the ECB's ultra-loose monetary policy.
Thus, Austria has already introduced quarantine measures and self-isolation, whereas Germany is considering such measures. This is a strong signal for a further decline in the euro against the US dollar. Meanwhile, in the US, high inflationary pressure is still boosting the greenback.
Most investors suppose that the Fed will raise the key interest rate as early as next year. They are already pricing in this possibility. The latest COT report for November indicated that long non-profit positions rose from the level of 192,544 to 198,181, while short non-profit positions jumped from 188,771 to 202,007. At the end of the week, the total non-commercial net position regained its negative value and amounted to -3,826 against 3,773. The weekly closing price decreased significantly, to the level of 1.1367 against 1.1587.
Indicators' signals:
Moving Average
Trading is conducted above the 30- and 50-day moving averages, which indicates a possible continuation of the euro's growth.
Important: The period and prices of moving averages are considered by the author on the hourly chart and differs from the general definition of the classic daily moving averages on the daily chart.
Bollinger Bands
In case of a decline, the average border of the indicator around 1.1221 will act as support.
Description of indicators:
Moving average determines the current trend by smoothing volatility and influence from news flow. Period is 50. It is marked with yellow on the chart.
Moving average determines the current trend by smoothing volatility and influence from news flow. Period is 30. It is marked with green on the chart.
MACD indicator (Moving Average Convergence/Divergence) Fast EMA period is 12. Slow EMA period is 26. SMA period is 9.
Bollinger Bands. Period is 20.
Non-profit speculative traders, such as individual traders, hedge funds and large institutions that use the futures market for speculative purposes and meet certain requirements.
Long non-commercial positions represent the total number of long positions opened by non-commercial traders.
Short non-commercial positions represent the total number of short positions opened by non-commercial traders.
The total non-commercial net position is the difference between the short and long positions opened by non-commercial traders.