 English
  Русский
 Bahasa Indonesia
 Bahasa Malay
 ไทย
ไทย Español
 Deutsch
 Български
 Français
 Tiếng Việt
 中文
中文 বাংলা
বাংলা हिन्दी
 Čeština
 Українська
 Română

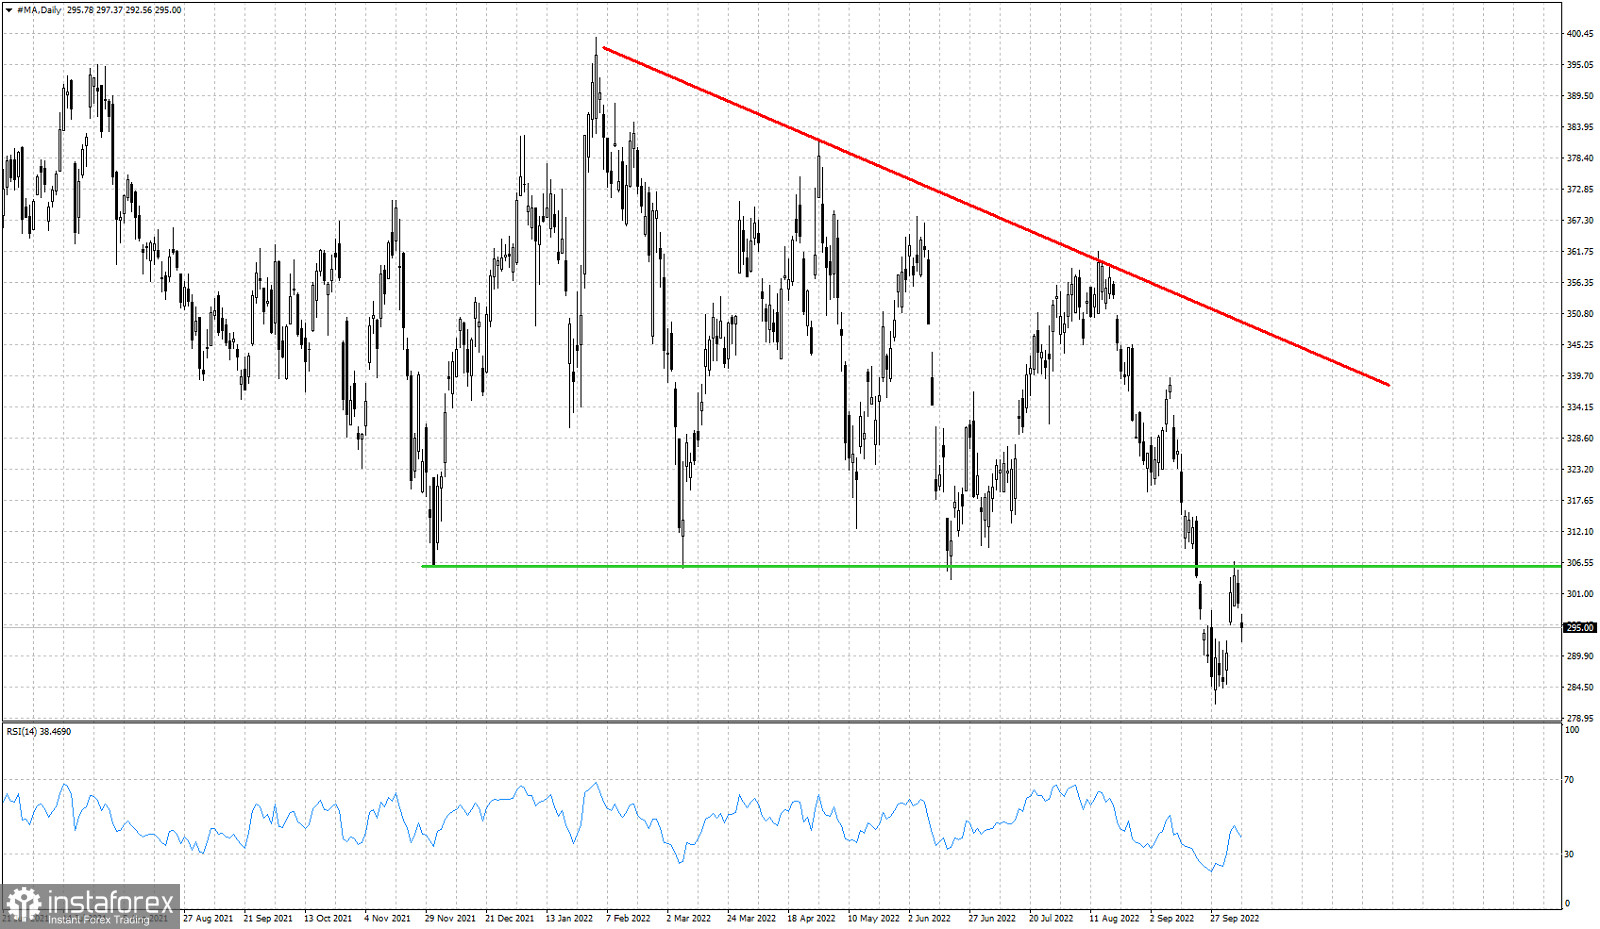
Red line -resistance
Green line- support (broken, now resistance)
MA stock price has broken below key horizontal support of $305 a couple weeks ago. The market bounced higher and so did the stock price of MasterCard. Price back tested the broken support trend line. Price made a back test of the breakdown area around $300-$305. The back test was a failure for bulls as price got rejected. Recent price action confirms the resistance at $300-$305. Previous support is now resistance. Bulls need to overcome this resistance area in order to hope for a bigger move higher towards the red trend line. As long as price is below the horizontal green line resistance we remain bearish.