 English
  Русский
 Bahasa Indonesia
 Bahasa Malay
 ไทย
ไทย Español
 Deutsch
 Български
 Français
 Tiếng Việt
 中文
中文 বাংলা
বাংলা हिन्दी
 Čeština
 Українська
 Română

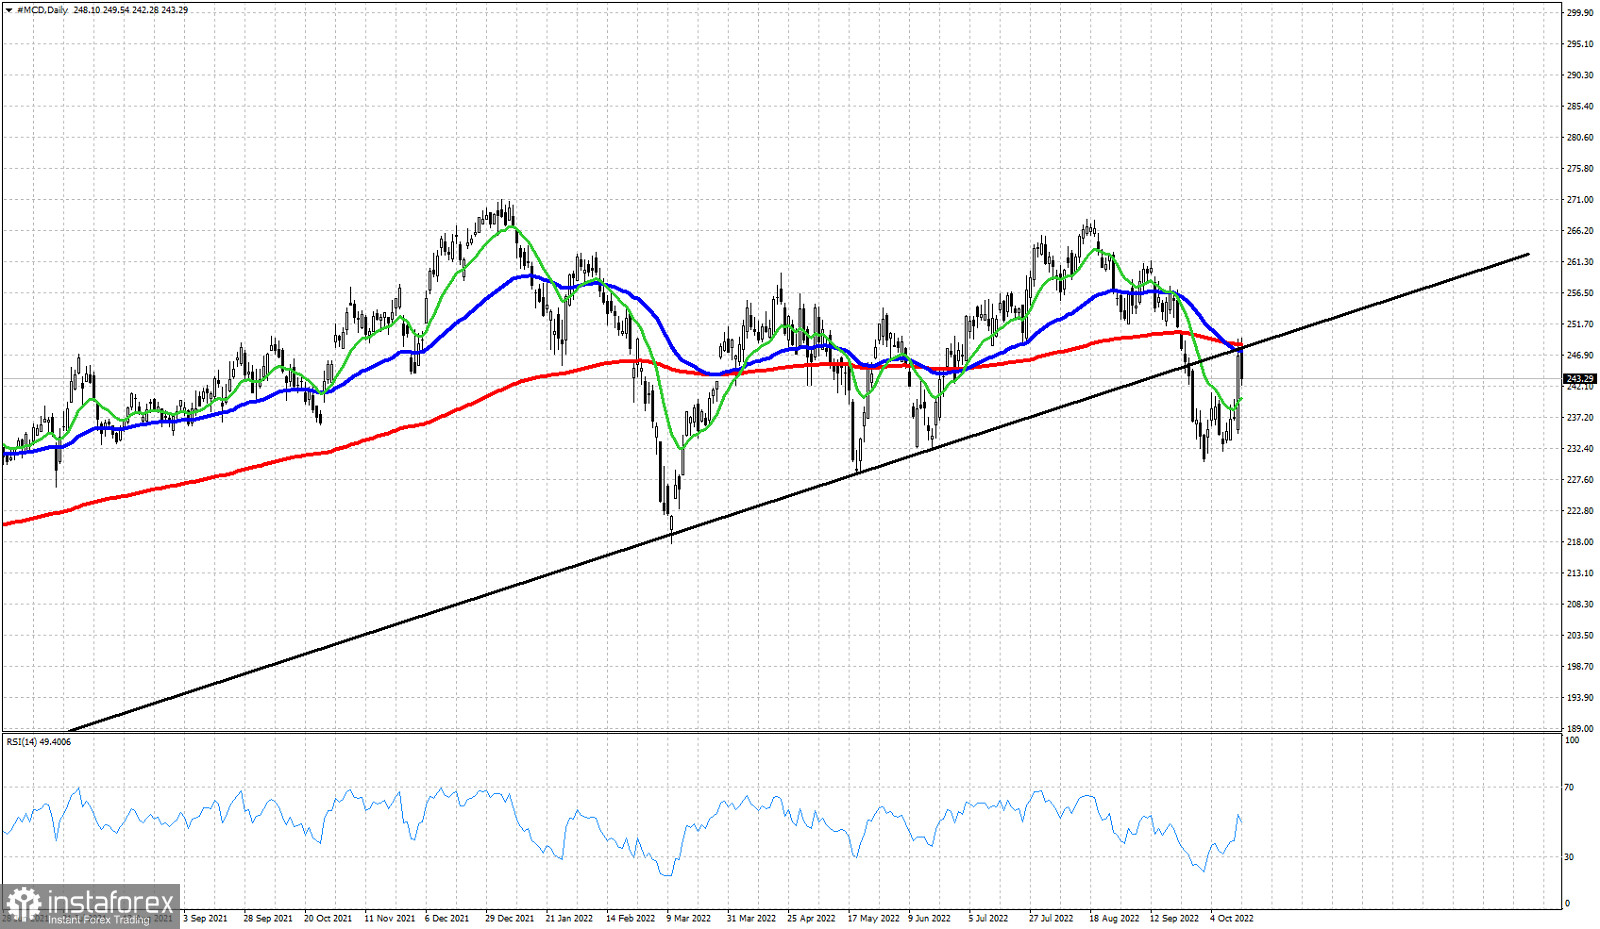
Black line - resistance
Red line- ema 200
Green line - ema 13
Blue line- ema 50
MCD closed today around $243 losing more than 1.4%. What is worrying for the technical picture in the MCD stock chart is the failure to recapture the $250 level. Price is still trading below the broken trend line which was once support and now resistance. Today price back tested the resistance trend line and got rejected. If this rejection is followed by a new low below $230, then we will have a major bearish signal for MCD stock price. Price also back tested the 50 and 200 EMA where it got rejected. Support by the EMA 13 is at $240. A break below this level will increase chances of a new low below $230. MCD stock price remains vulnerable to more downside.