 English
  Русский
 Bahasa Indonesia
 Bahasa Malay
 ไทย
ไทย Español
 Deutsch
 Български
 Français
 Tiếng Việt
 中文
中文 বাংলা
বাংলা हिन्दी
 Čeština
 Українська
 Română

The purchase of Micron shares is hedged by the sale of AIG.
Purchase of shares of Micron Technology (#MU). Manufacturer of semiconductor devices.
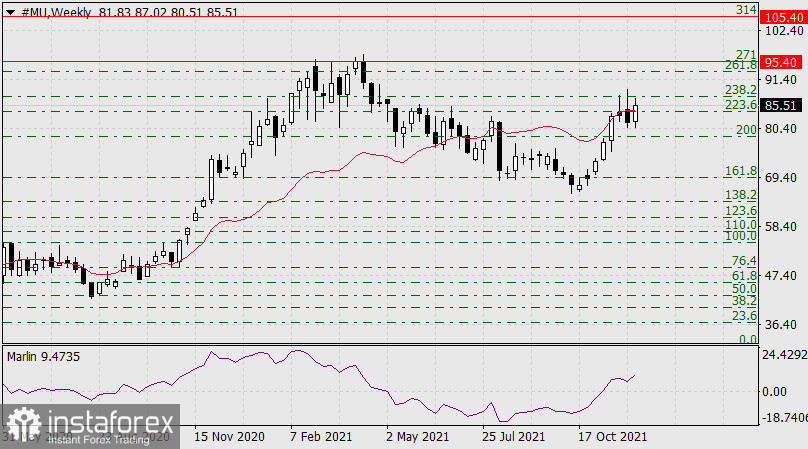
On the weekly scale chart, the price went above the balance indicator line, trying to gain a foothold above the Fibonacci level of 223.6% and go above the level of 238.6%. The Marlin oscillator is growing, which together gives a sign of further growth to the Fibonacci level of 271.0% (95.40) in the area of the peaks of March-April 2021. Fixing above the level can extend the growth to the Fibonacci level of 314.0% at the price of 104.40.
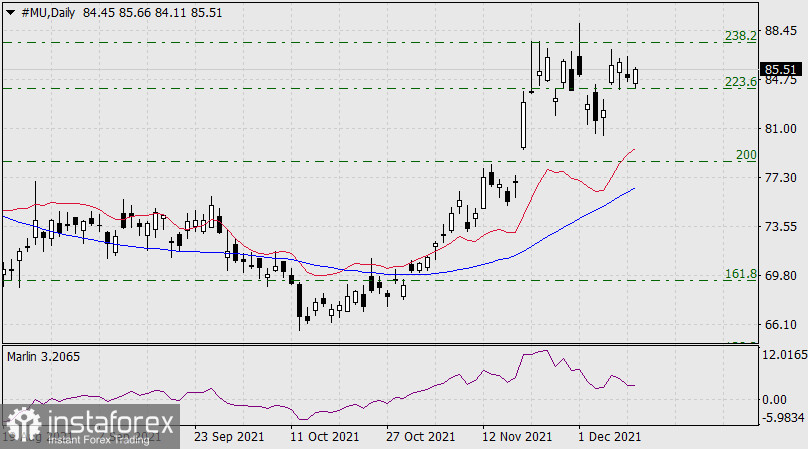
On the daily chart, the price has been consolidating for the last 4 days in the range of Fibonacci levels of 223.6-238.2%, the exit from which is expected to go up. The Marlin oscillator has left the overbought zone, now it is turning up into a new wave of growth with fresh forces.
Sale of shares of American International Group (#AIG). American Insurance and Finance Corporation.
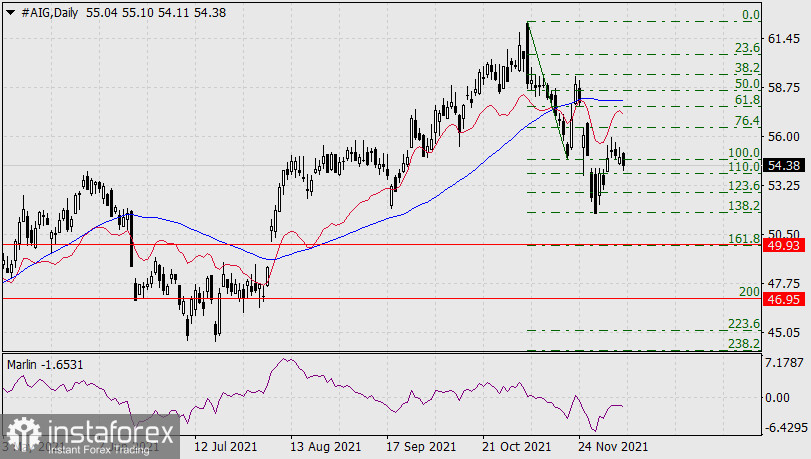
On the daily scale chart, the price went below the Fibonacci level of 100.0% (minimum on November 19) after the previously failed exit above the level on December 7-9. All these events occur under the indicator lines of the balance and the MACD, that is, in line with the medium-term downward trend. The Marlin oscillator is in the negative zone, turning down.
The goals of the movement are determined by the Fibonacci levels: 161,8% - 49.93, 200,0% - 46.95. These levels have repeatedly acted as supports and resistance in history since 2005.