 English
  Русский
 Bahasa Indonesia
 Bahasa Malay
 ไทย
ไทย Español
 Deutsch
 Български
 Français
 Tiếng Việt
 中文
中文 বাংলা
বাংলা हिन्दी
 Čeština
 Українська
 Română

:: Daily ::
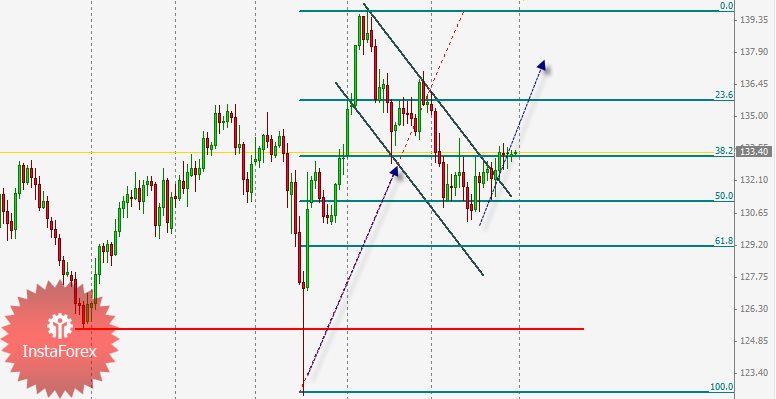
The GBP / JPY currency pair showed an obvious hummer candlestick at testing the support level 125.47 which is a historical low
this candlestick indicates upside movemet confirmed further
the upside movement was contained at the resistance level 139.75 which stopped the upside swing of the pair leading to correction forming a flag pattern
The support level 131.20 which is 50% fibonatcci of the last swing up held the price above preventing further decline
The 25 May's daily candle closed outside the upper limit of the flag indicating continuation of the upside movement technically .
Now the price is consolidating around the 38.2% Fibonatcci level waiting for its break to resume the upside movement .
:: 4H ::
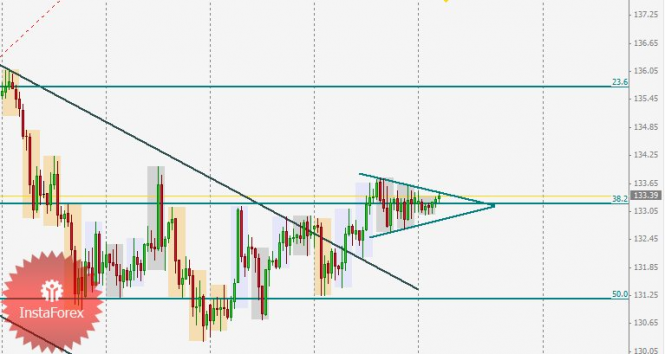
on the 4H chart the price is consolidating in a triangle pattern at 28.2% Fibonatcci level
We recommended going long on the pair since it broke the channel ( Flag ) at 25 May
For those who missed the trade can join it as soon as the pair closes outside the upper side of the triangle for more confirmation
Long position has potential target at 134.80 then 135.55 ( 23% fibonatcci ) with further targets to be mentioned later
It's important to mention that SL for long position should be below the last buttom ( 130.22 ) as break of this level allow the pair to reach 129.32