 English
  Русский
 Bahasa Indonesia
 Bahasa Malay
 ไทย
ไทย Español
 Deutsch
 Български
 Français
 Tiếng Việt
 中文
中文 বাংলা
বাংলা हिन्दी
 Čeština
 Українська
 Română

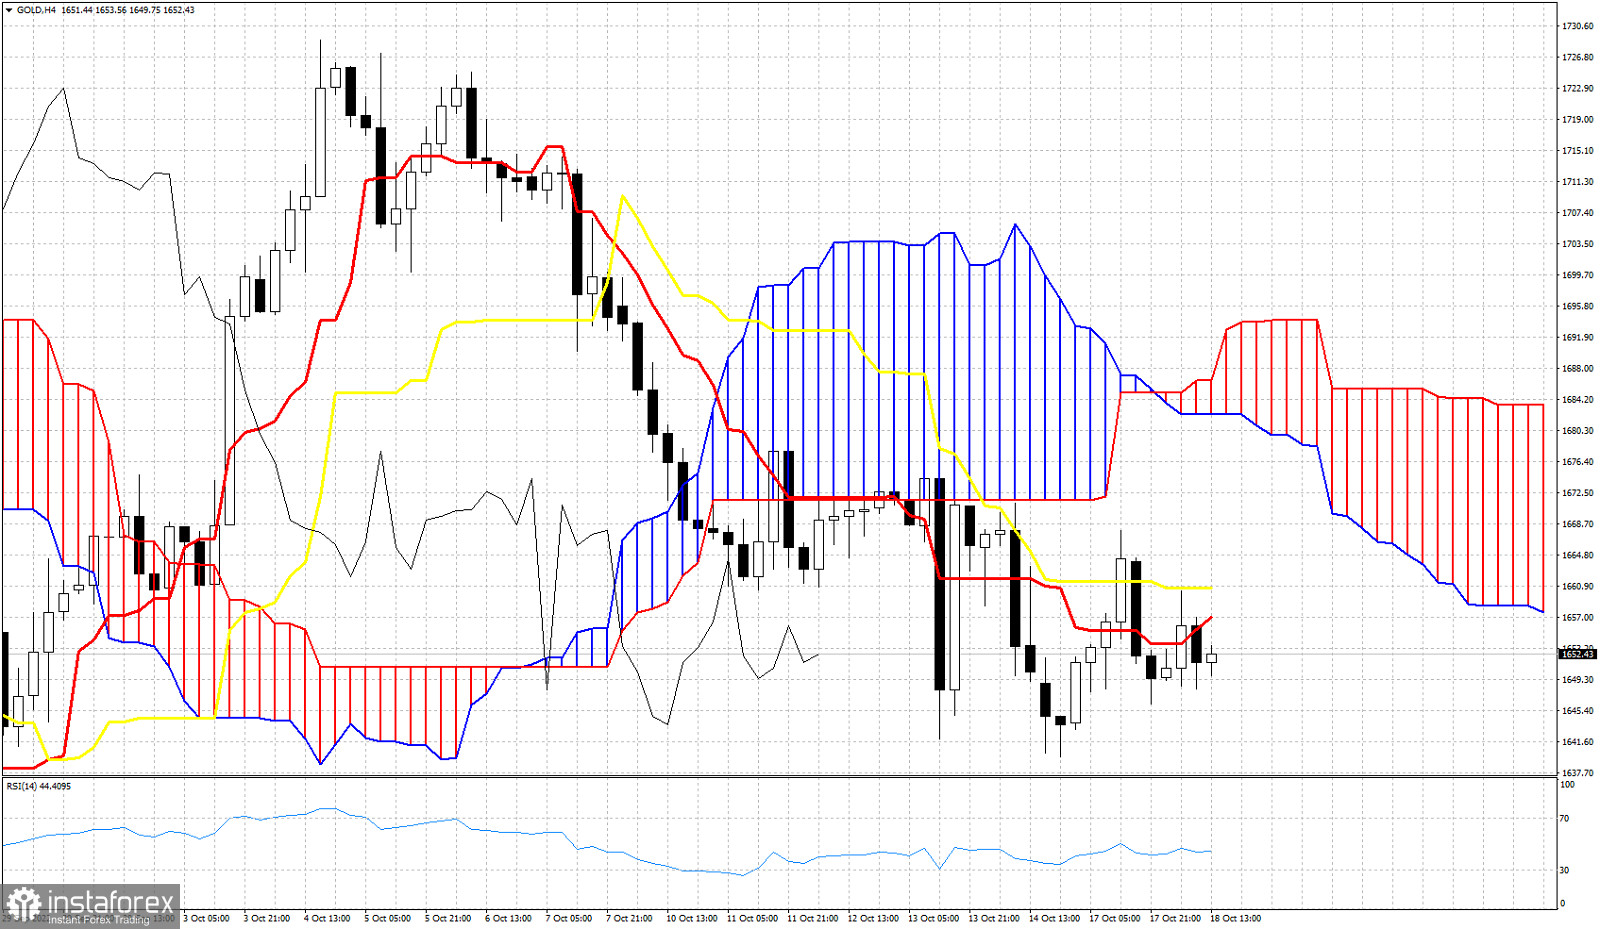
Gold price is trading around $1,650. Short-term trend remains bearish in Gold according to the Ichimoku cloud indicator. We use this indicator in the 4 hour chart in order to identify key resistance levels and possible bounce targets. Price is well below the Kumo (cloud). Price is currently below both the tenkan-sen (red line indicator) and the kijun-sen (yellow line indicator). Resistance by these two indicators is at $1,657 and $1,660 respectively. A 4 hour candlestick close above this resistance area, will open the way for a bounce towards the cloud at $1,680-$1,693 zone. The Chikou span (black line indicator) is also below the candlestick pattern confirming bearish trend. So far there is no sign of a trend reversal even for the near term. Bears remain in control of the trend. In a previous analysis we noted that a bounce higher towards $1,700 is justified. The Ichimoku cloud indicator will signal that such a bounce is coming once we see price break above the kijun-sen.