 English
  Русский
 Bahasa Indonesia
 Bahasa Malay
 ไทย
ไทย Español
 Deutsch
 Български
 Français
 Tiếng Việt
 中文
中文 বাংলা
বাংলা हिन्दी
 Čeština
 Українська
 Română

Trend analysis (pic. 1).
Today, the pair may resume an upward moment from the level of 1.1236 (Friday's daily candlestick closing) to the target level of 1.1259, the Fibonacci retracement level of 14.6% (blue dotted line). When testing this level, the price is likely to approach the target level of 1.1306, the Fibonacci level of 23.6% (blue dotted line).
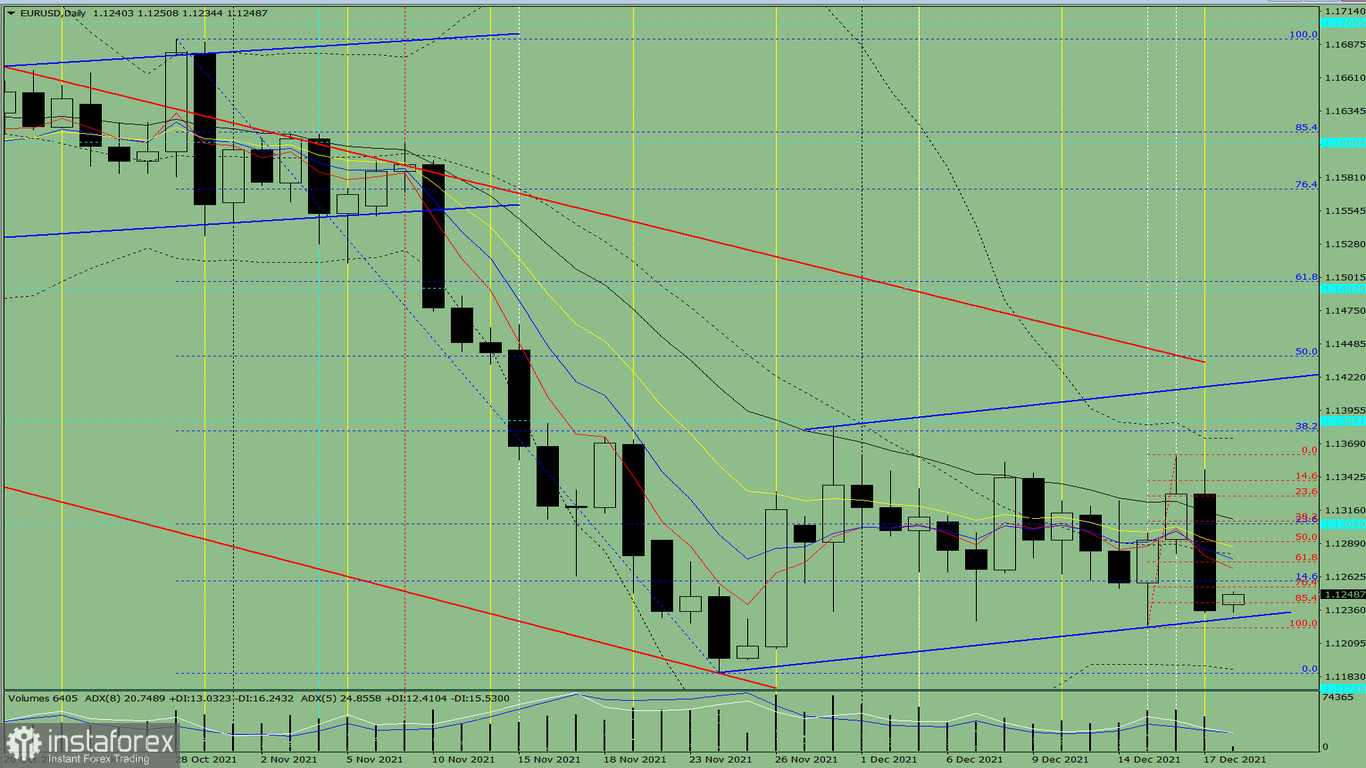
Pic. 1 (daily chart).
Complex analysis:
- technical indicator analysis– up;
- Fibonacci retracement levels - up;
- volumes - up;
- candlestick analysis - up;
- trend analysis - up;
- Bollinger lines - up;
- weekly chart-up.
Conclusion:
Today, the pair may resume an upward moment from the level of 1.1236 (Friday's daily candlestick closing) to the target level of 1.1259, the Fibonacci retracement level of 14.6% (blue dotted line). When testing this level, the price is likely to approach the target level of 1.1306, the Fibonacci level of 23.6% (blue dotted line).
An unlikely scenario is that the price may drop to the target level of 1.1185, the lower fractal (blue dotted line) from the level of 1.1236 (closing of Friday's daily candlestick). When testing this level, the price may rise to the target of 1.1259, the Fibonacci level of 14.6% (blue dotted line).