 English
  Русский
 Bahasa Indonesia
 Bahasa Malay
 ไทย
ไทย Español
 Deutsch
 Български
 Français
 Tiếng Việt
 中文
中文 বাংলা
বাংলা हिन्दी
 Čeština
 Українська
 Română

:: Daily ::
_source!.png)
Early on the Daily chart , The EUR/JPY pair formed a very strong bullish hummer at the level of support 106.80 (which is a previous low) indicating further upside movement
strong upside movement followed this signal up to 123.35 from which the price began to make lower highs and lower lows
After reaching the 61.8% Fibonatcci price has been consolidating inside a bullish channel making higher lows indicating weakness of bears at this junction of the chart
The Daily candle also broke 38.2% Fibonatcci level and closed above it .
The price now is testing the upper limit of this channel which is also a level of resistance
::4H::
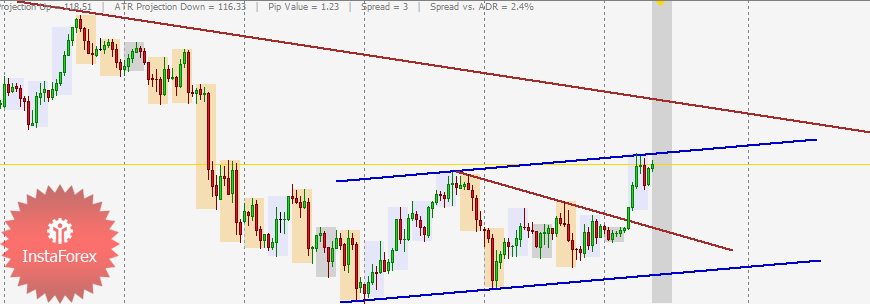
As we mentioned before closure above the short term downtrend gave the signal to go long which hit its TP at 117.30
Now the price is testing the upper limit of the channel which force the price to retrace alittle
Based on the previous analysis :
IF the price manages to make higher high breaking the upper limit of the channel this gives the signal to go long again with target up to 119.20 at the long term downtrend .
IF the price fails to break the upper side of the channel this gives the signal to go short with small targets down to 116.00 which is the backside of the broken short term downtrend which will be a good level to go long at if the price shows signs of reversal there .