 English
  Русский
 Bahasa Indonesia
 Bahasa Malay
 ไทย
ไทย Español
 Deutsch
 Български
 Français
 Tiếng Việt
 中文
中文 বাংলা
বাংলা हिन्दी
 Čeština
 Українська
 Română

Here are the details of the economic calendar for December 28, 2021:
Traders faced low liquidity in the market again yesterday – the quotes were mostly in place, and only the pound sterling showed speculative interest albeit the UK having an official holiday.
There were no statistics. The only thing that could be paid attention to was the S&P/CaseShiller house price index in the United States, which declined from 19.1% to 18.4%.
The decline in the index did not affect the market in any way.
Analysis of trading charts from December 28:
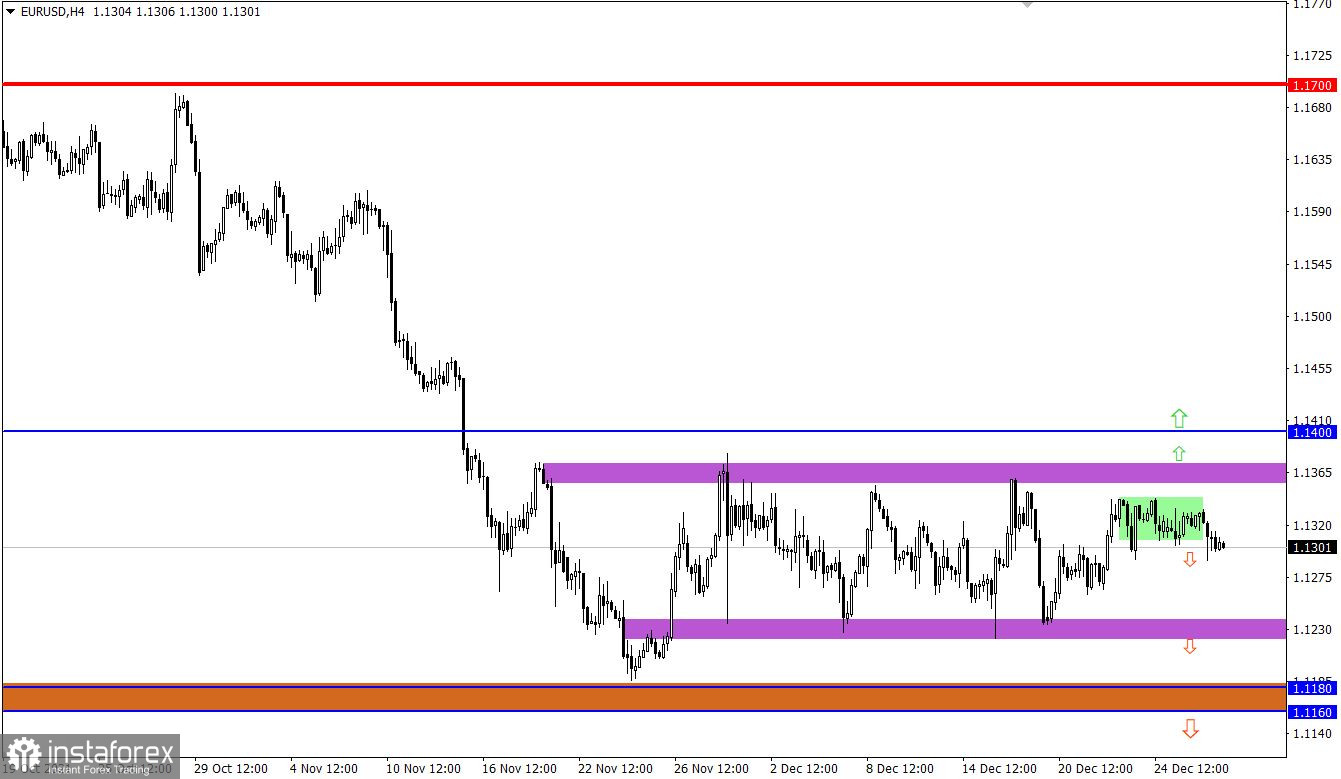
The EUR/USD pair continues to move in the sideways channel 1.1225/1.1355, where the wide amplitude changed to a narrow one within the upper border. Despite the variable stagnation, the sequence of the movement from the upper border to a side one is still relevant in the market. This indicates a high degree of uncertainty among traders.
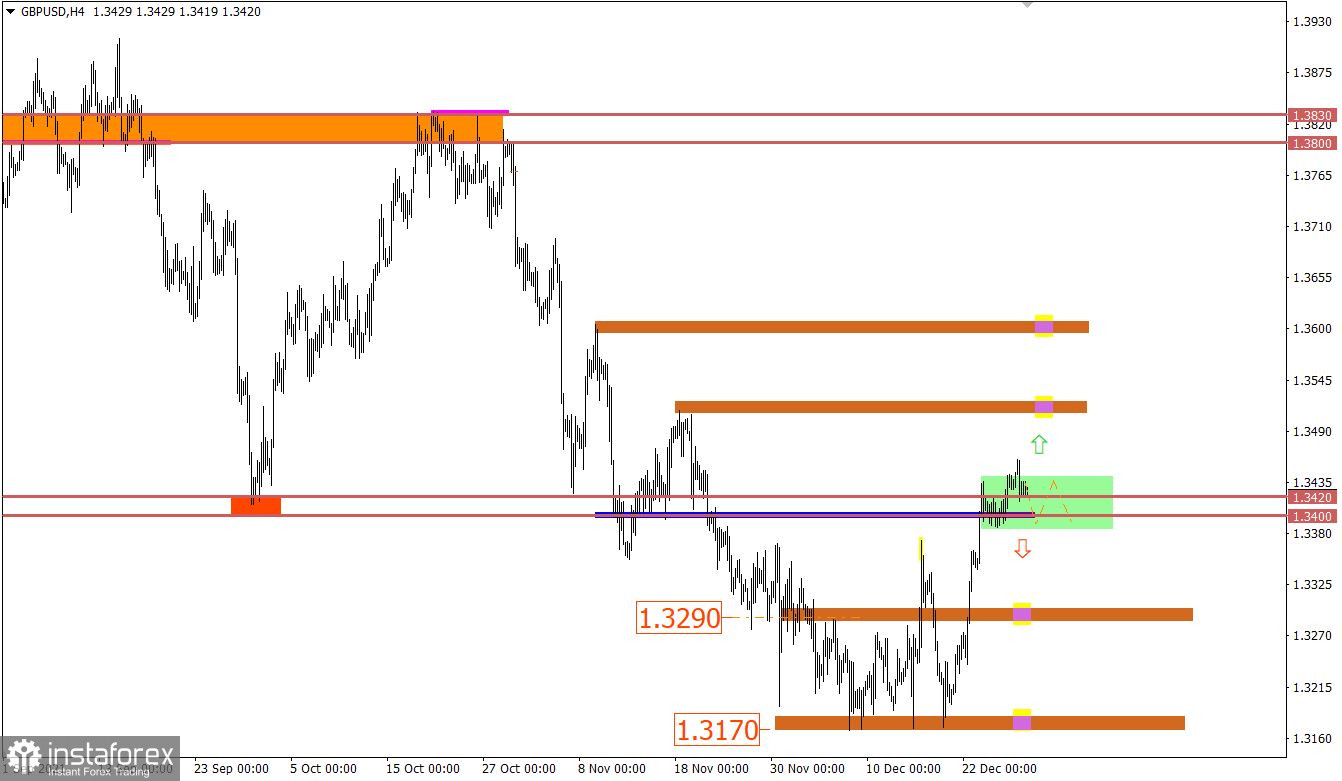
The GBP/USD pair continued to move within its upper border after breaking through the resistance area of 1.3400/1.3420. This signals a slowdown in the upward cycle, which may negatively affect the volume of short positions.
The downward trend remains on the daily chart. A correction has appeared in its structure, which does not break the trend cycle.
December 29 economic calendar:
The UK has returned to the market today, but, based on the statistics, the macroeconomic calendar is somewhat empty again. Europe's lending market data will be released, which is expected to rise insignificantly. On the other hand, the United States will publish an index of pending real estate sales, which is forecast to rise by 0.6% in November.
The data is insignificant, so it will be unnoticed by the market again.
Trading plan for EUR/USD on December 29:
In this situation, traders start from a sideways channel, where the same pattern has been observed for a long time in the form of a sequential price rebound. After that, stagnation within the upper border will initially indicate the possibility of a rebound towards the range of 1.1265-1.1225. It should be noted that the flat is a temporary manifestation of the market, and it will end soon. Thus, tactics for the breakdown of a particular border will be the most in-demand.
Trading plan for GBP/USD on December 29:
The market may change the upward cycle to a sideways one since there is a gradual deceleration in the corrective movement. This scenario considers the price movement within the borders of 1.3385/1.3450.
It is worth considering that the above scenario has a short-term effect since the stagnation later will be regarded as a process of accumulation of trading forces, which will lead to new speculative price surges.
What is reflected in the trading charts?
A candlestick chart view is graphical rectangles of white and black light, with sticks on top and bottom. When analyzing each candle in detail, you will see its characteristics of a relative period: the opening price, closing price, and maximum and minimum prices.
Horizontal levels are price coordinates, relative to which a stop or a price reversal may occur. These levels are called support and resistance in the market.
Circles and rectangles are highlighted examples where the price of the story unfolded. This color selection indicates horizontal lines that may put pressure on the quote in the future.
The up/down arrows are the reference points of the possible price direction in the future.