 English
  Русский
 Bahasa Indonesia
 Bahasa Malay
 ไทย
ไทย Español
 Deutsch
 Български
 Français
 Tiếng Việt
 中文
中文 বাংলা
বাংলা हिन्दी
 Čeština
 Українська
 Română

Trend analysis (Fig. 1)
Today, the price from the level of 1.1360 (closing of Friday's daily candlestick) is likely to start declining to the target of 1.1321 – 21 EMAs (black thin line). Once this line is tested, it may continue to rise to the target of 1.1403 – the resistance line (blue bold line).
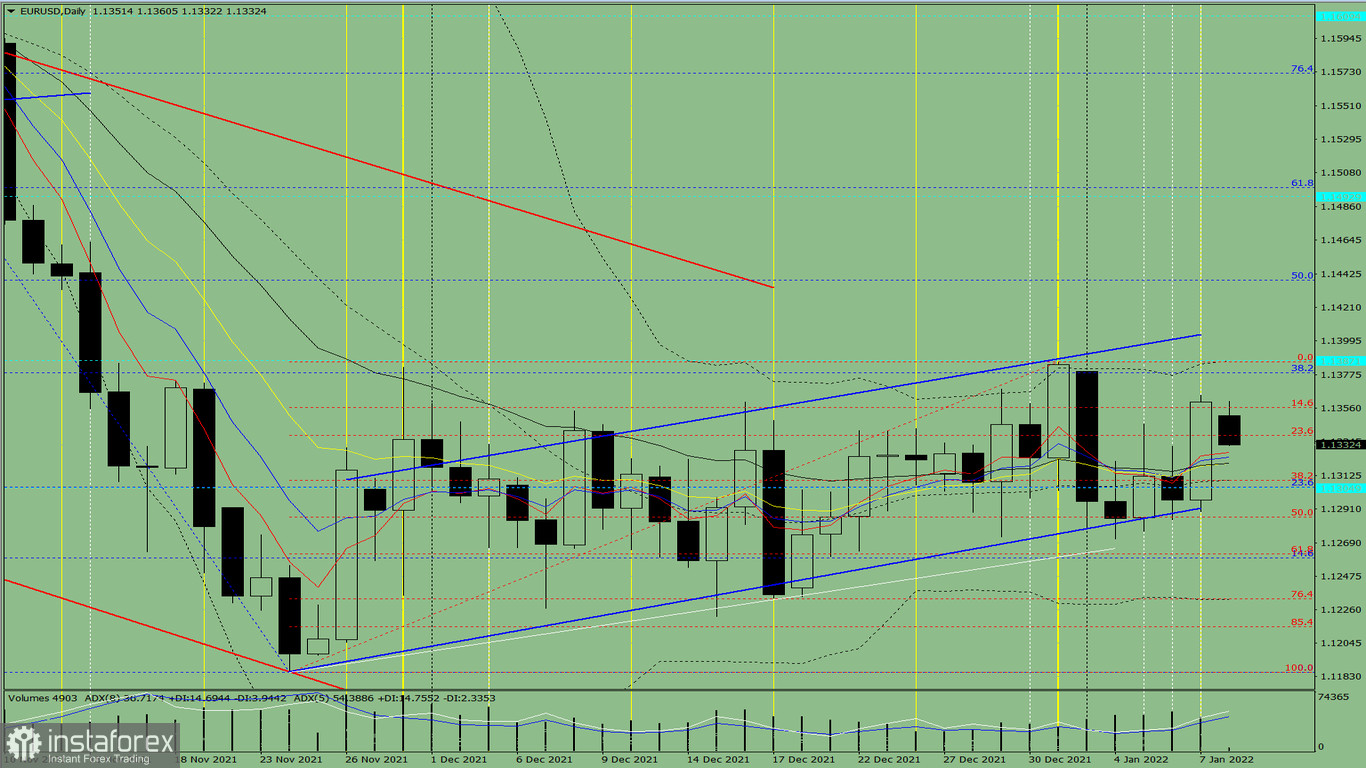
Fig 1 (daily chart)
Comprehensive analysis:
- Indicator analysis - down
- Fibonacci levels - down
- Volumes - down
- Candlestick analysis - down
- Trend analysis - up
- Bollinger lines - down
- Weekly chart - down
General conclusion:
The price from the level of 1.1360 (closing of Friday's daily candlestick) may begin to fall to the target of 1.1321 – 21 EMAs (black thin line). After testing this line, it may further increase to the target of 1.1403 – the resistance line (blue bold line).
Alternatively, the price from the level of 1.1360 (closing of Friday's daily candlestick) can possibly plummet to the target of 1.1309 – the pullback level of 38.2% (red dashed line), and then continue its growth to the target of 1.1364 - the upper fractal (daily candle from 7.1.2022). After reaching this level, the upward movement will resume.