 English
  Русский
 Bahasa Indonesia
 Bahasa Malay
 ไทย
ไทย Español
 Deutsch
 Български
 Français
 Tiếng Việt
 中文
中文 বাংলা
বাংলা हिन्दी
 Čeština
 Українська
 Română

Here are the details of the economic calendar on January 12, 2021:
America's annual inflation in December 2021 accelerated to 7%, which is the highest value since June 1982. The data is terrible, which frightened investors and led to speculative manipulations in the financial markets.
The currency market reacted to the inflation growth by selling the US dollar.
Analysis of trading charts from January 12:
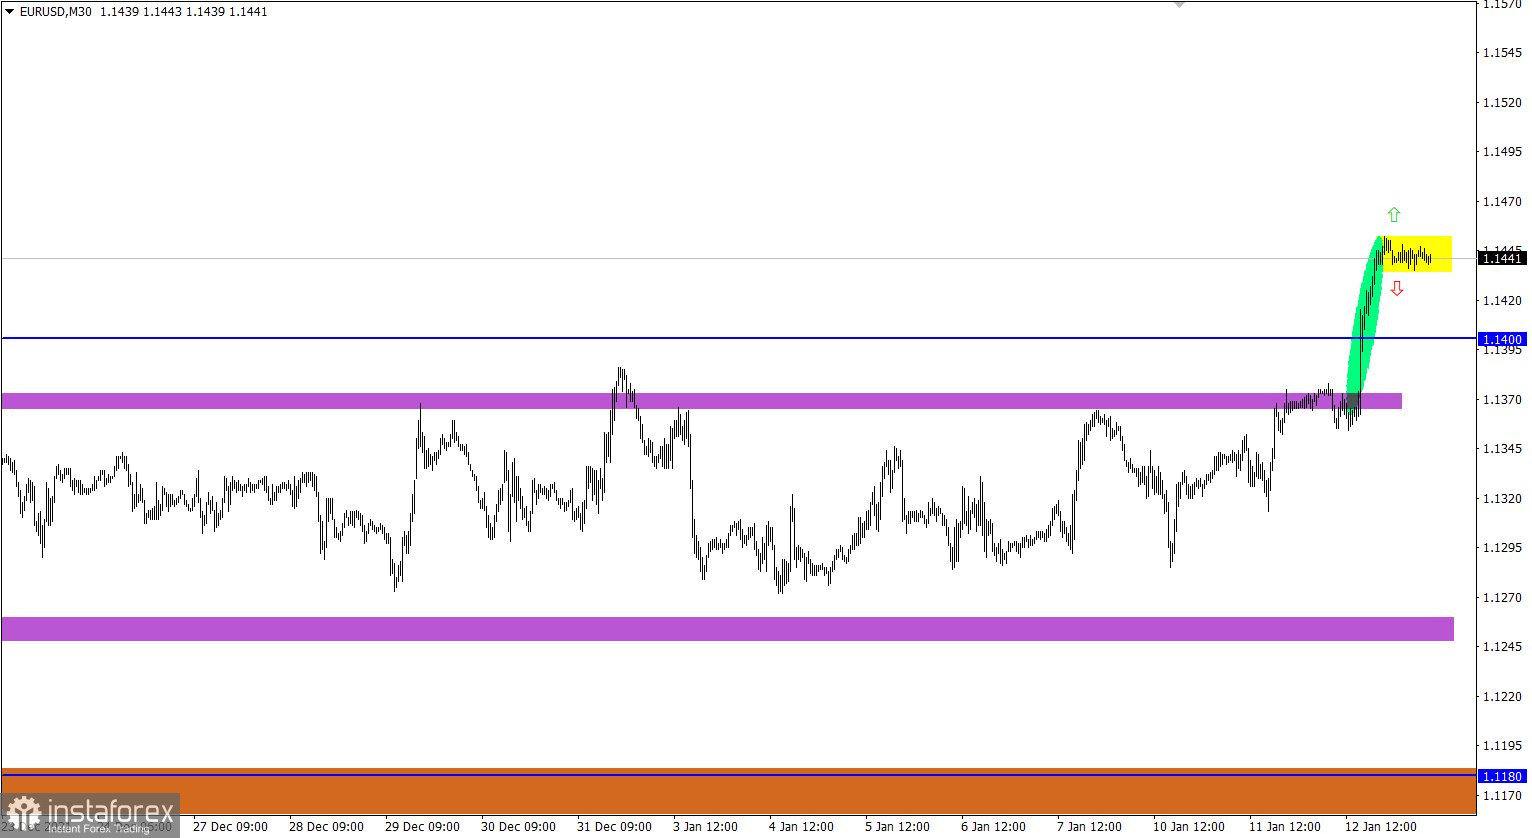
The EUR/USD currency pair broke out of the sideways channel for the first time in one and a half months, keeping the quote above the pivot level of 1.1400. Such a move led to an increase in speculative interest, which caused the euro to soar by 90 points.
On the daily chart, the flat was replaced by a correction in relation to the downward trend.
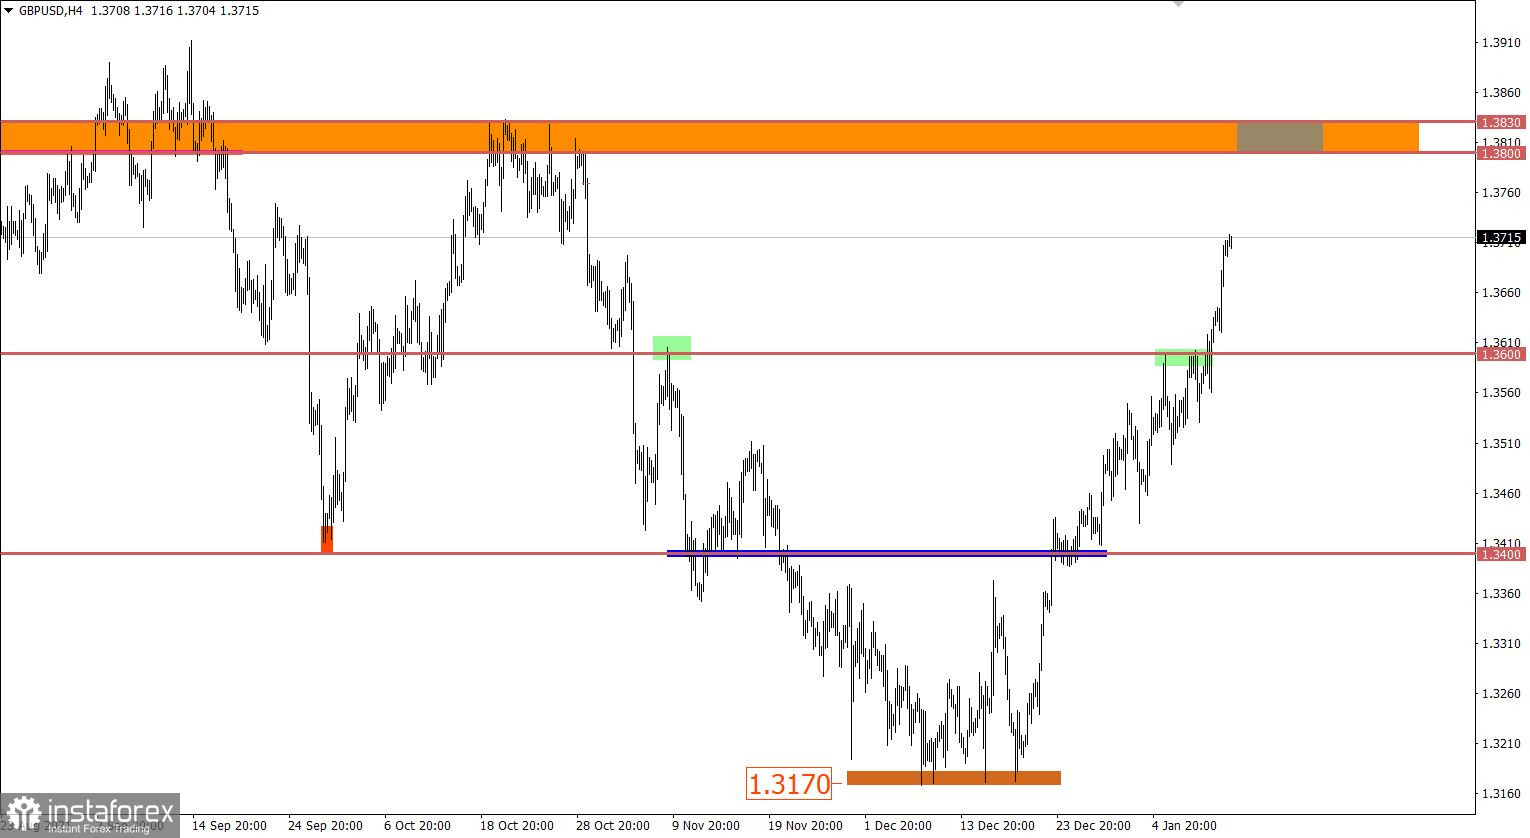
The GBP/USD pair continues to demonstrate an upward interest despite the growing overbought level. This has already led to a breakdown of a number of important price levels and casts doubt on the downward trend from the beginning of June last year. In this situation, speculative interest is clearly visible, which pushes the pound sterling day by day.

January 13 economic calendar:
Today, weekly figures on applications for unemployment benefits in the US will be published, whose volume is expected to decline.
Details of statistics:
The volume of initial applications for benefits may fall from 207 thousand to 200 thousand.
The volume of repeated applications for benefits may fall from 1,754 thousand to 1,733 thousand.
The statistics are positive, which could be beneficial for the US dollar if they coincide.
Time targeting
Applications for US unemployment benefits - 13:30 Universal time
Trading plan for EUR/USD on January 13:
Stagnation in the form of consolidation signals a high degree of uncertainty among market participants, where the overbought status of the euro indicates the possibility of a technical pullback. On the contrary, the upward inertia relative to the passed flat indicates the possibility of its prolongation.
In this situation, a consolidation at 1.1435/1.1452 is considered the starting point. So, keeping the price outside a particular border will indicate a local price movement, revealing the scenario of a technical pullback or prolongation of inertia.
Trading plan for GBP/USD on January 13:
The inertia move is still relevant in the market, despite the signal that the pound is overbought. Therefore, holding the price firmly above the level of 1.3710 may lead to a movement towards the interaction area of trading forces 1.3800/1.3835.
An alternative scenario considers temporary stagnation in the area of 1.3700, which may develop into a technical pullback.
What is reflected in the trading charts?
A candlestick chart view is graphical rectangles of white and black light, with sticks on top and bottom. When analyzing each candle in detail, you will see its characteristics of a relative period: the opening price, closing price, and maximum and minimum prices.
Horizontal levels are price coordinates, relative to which a stop or a price reversal may occur. These levels are called support and resistance in the market.
Circles and rectangles are highlighted examples where the price of the story unfolded. This color selection indicates horizontal lines that may put pressure on the quote in the future.
The up/down arrows are the reference points of the possible price direction in the future.