 English
  Русский
 Bahasa Indonesia
 Bahasa Malay
 ไทย
ไทย Español
 Deutsch
 Български
 Français
 Tiếng Việt
 中文
中文 বাংলা
বাংলা हिन्दी
 Čeština
 Українська
 Română

Here are the details of the economic calendar on January 17, 2021:
Monday was traditionally accompanied by a blank macroeconomic calendar. It was a holiday in the US due to the celebration of Martin Luther King Day. Therefore, trading volumes were reduced.
Analysis of trading charts from January 17:
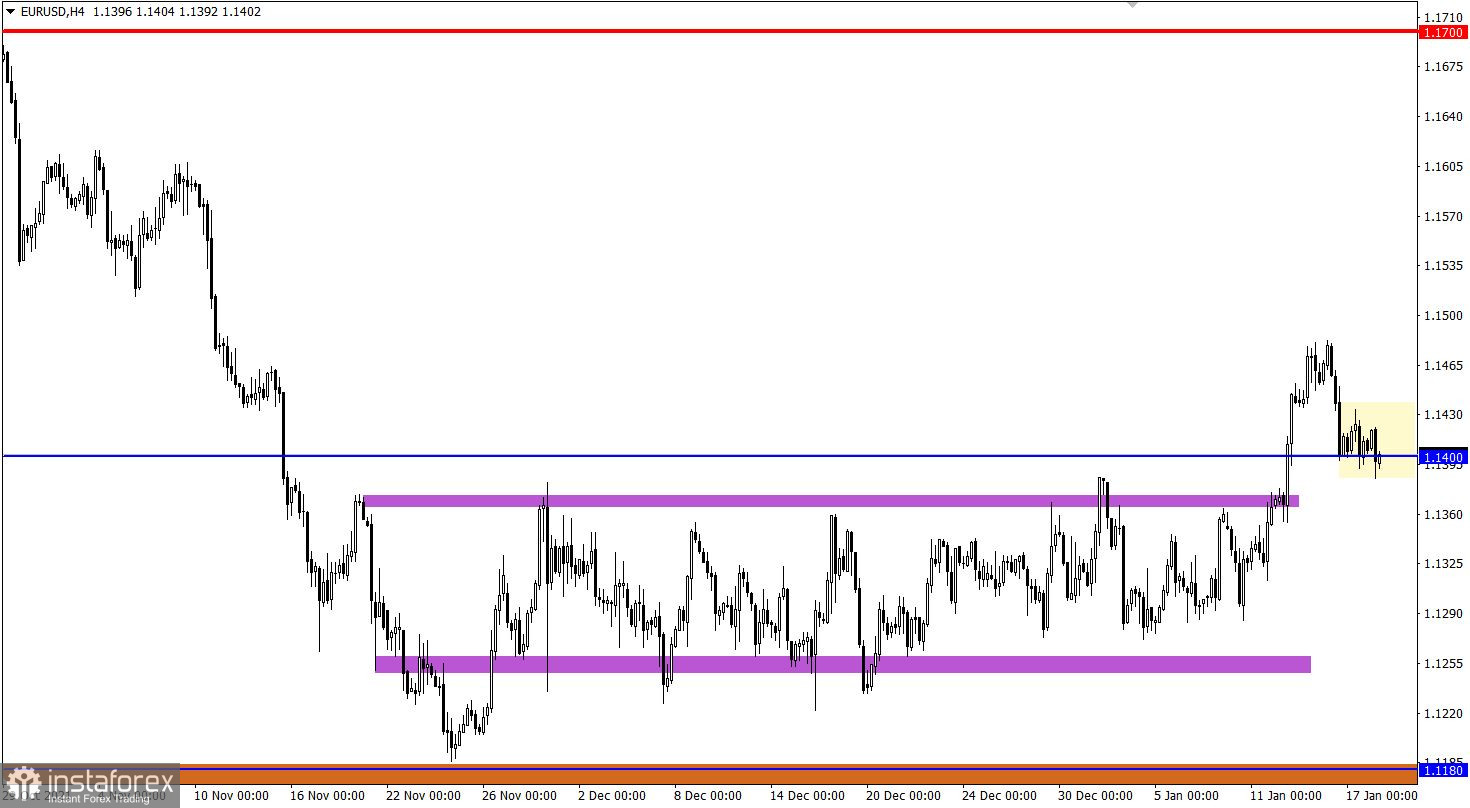
The EUR/USD pair switched to correction mode after its sharp growth, returning the quote to the previously broken level of 1.1400. Based on the price behavior, the level of 1.1400 acts as support, along which a local stagnation has emerged.
The trend did not change on the daily chart. Instead, the seven-week flat was replaced by a correction in relation to the downward trend.
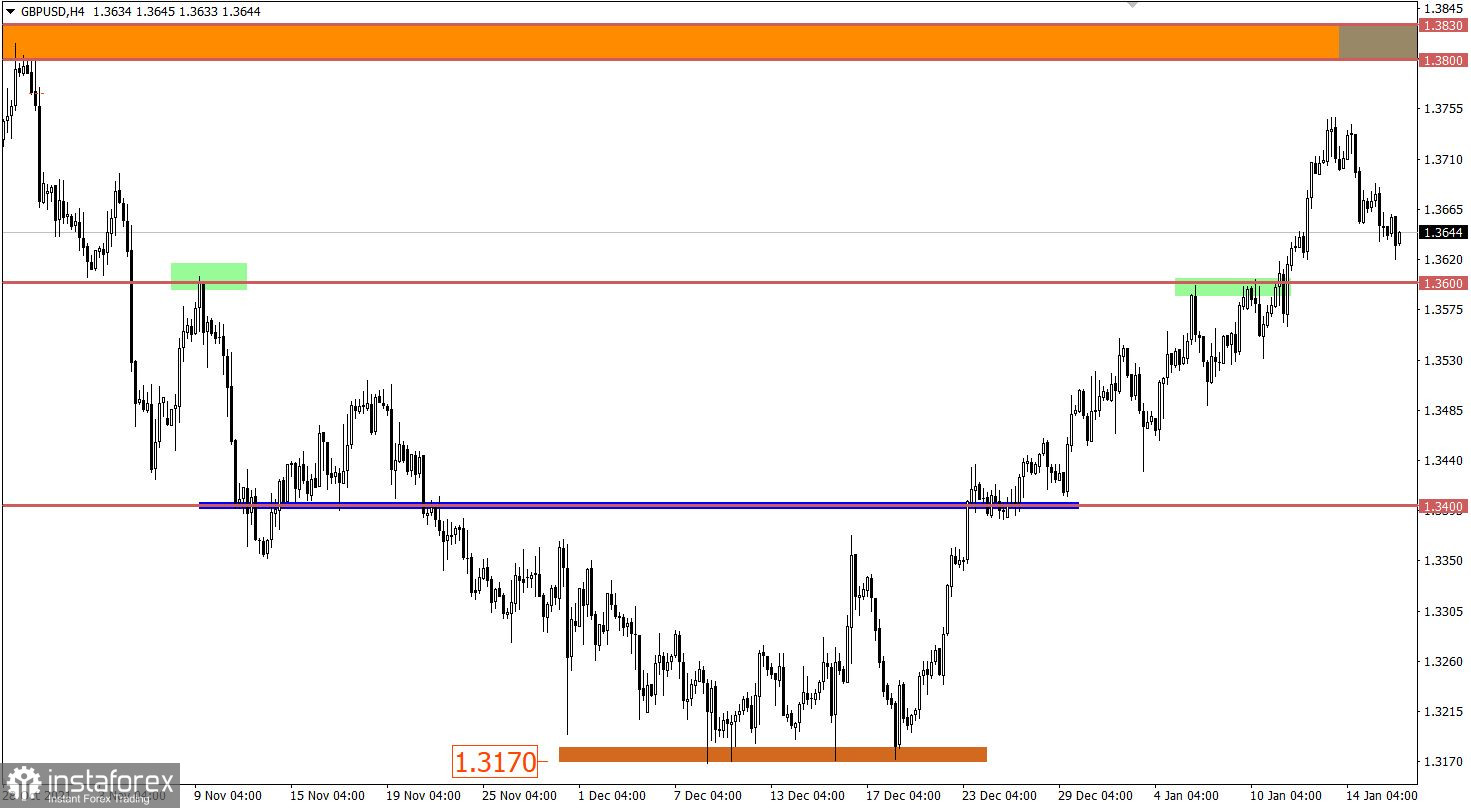
The GBP/USD currency pair still has an overbought status despite the pullback stage from the local high of 1.3750. This is due to the fact that the pound has risen by more than 550 points in four weeks, eventually showing signs of speculative behavior.

January 18 economic calendar:
The UK's labor market data were published at 7:00 Universal time today, where the unemployment rate declined from 4.2% to 4.1%. The positive news did not end there, as the number of applications for benefits in December also fell by 43.3 thousand, against the expected 38.6 thousand. The data differed only on employment, where they predicted its growth by 125 thousand, but in the end, they received 60 thousand.
The UK statistics are positive as a whole.
Meanwhile, Europe and the United States are not expected to publish important macroeconomic data.
Trading plan for EUR/USD on January 18:
In this situation, the stagnation along the level of 1.1400 plays a key role in the market, where the levels of 1.1380 and 1.1435 serve as the borders of the deviation. Holding the price outside one or another border in a four-hour period may indicate the next path of the quote.
We express the above details into trading signals:
Buy positions should be considered after holding the price above the level of 1.1435 with the prospect moving to 1.1480.
Sell positions should be considered after holding the price below the level of 1.1380 with the prospect of moving to 1.1360.
Trading plan for GBP/USD on January 18:
In this situation, the pullback is aimed towards the level of 1.3600, around which it is possible to reduce the volume of short positions. In this case, speculators may well intercept the sellers' interest by resuming an inertial course in the market. But in order to move from the pullback stage to a major correction, the quote needs to stay below the 1.3560 mark in a four-hour period.
What is reflected in the trading charts?
A candlestick chart view is graphical rectangles of white and black light, with sticks on top and bottom. When analyzing each candle in detail, you will see its characteristics of a relative period: the opening price, closing price, and maximum and minimum prices.
Horizontal levels are price coordinates, relative to which a stop or a price reversal may occur. These levels are called support and resistance in the market.
Circles and rectangles are highlighted examples where the price of the story unfolded. This color selection indicates horizontal lines that may put pressure on the quote in the future.
The up/down arrows are the reference points of the possible price direction in the future.