 English
  Русский
 Bahasa Indonesia
 Bahasa Malay
 ไทย
ไทย Español
 Deutsch
 Български
 Français
 Tiếng Việt
 中文
中文 বাংলা
বাংলা हिन्दी
 Čeština
 Українська
 Română

To open long positions on GBP/USD, you need:
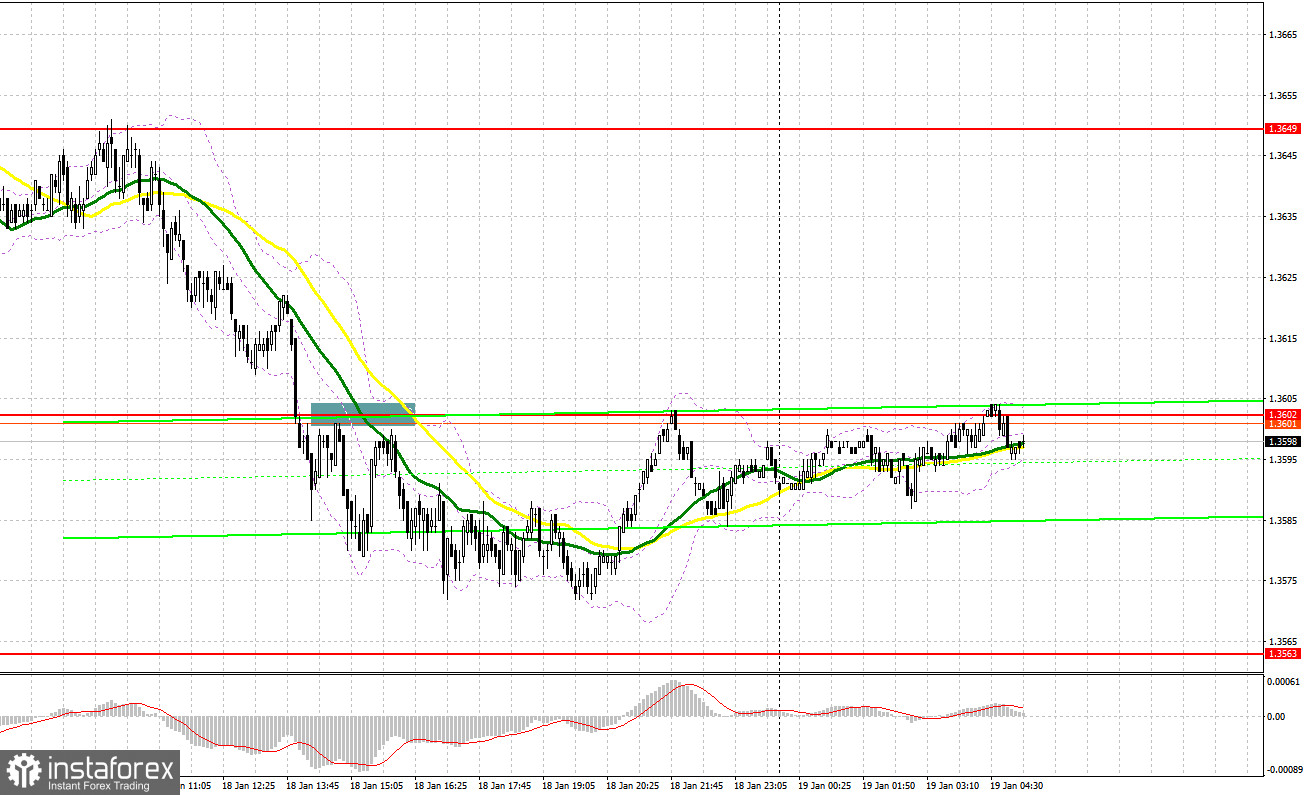
Yesterday, only one signal was formed to sell the pound in the afternoon. Let's take a look at the 5-minute chart and figure out what happened. I paid attention to several levels in my morning forecast, but due to excessively low volatility, we never managed to get to them. Due to the lack of tests on 1.3612 and 1.3656, no entry points were formed into the market. Data on the UK labor market turned out to be much better than economists' forecasts, but this did not lead to active long positions on the pound, which resulted in another wave of sell-off during the US session. In the second half of the day, a breakthrough and a reverse test of support at 1.3602 gave a good entry point into short positions, which I emphasized in my forecast. As a result, GBP/USD decreased by 30 points.
A very strong bearish correction at any moment can lead to a reversal of the upward trend, which we have been able to observe since the end of December 2021. To save the situation, the bulls will need very good data on inflation in the UK, but most likely, the whole focus will shift to the afternoon, when the hearings of the Treasury select committee and the speech of Bank of England Governor Andrew Bailey will take place. Therefore, do not be surprised if there is no active market movement during the European session again.
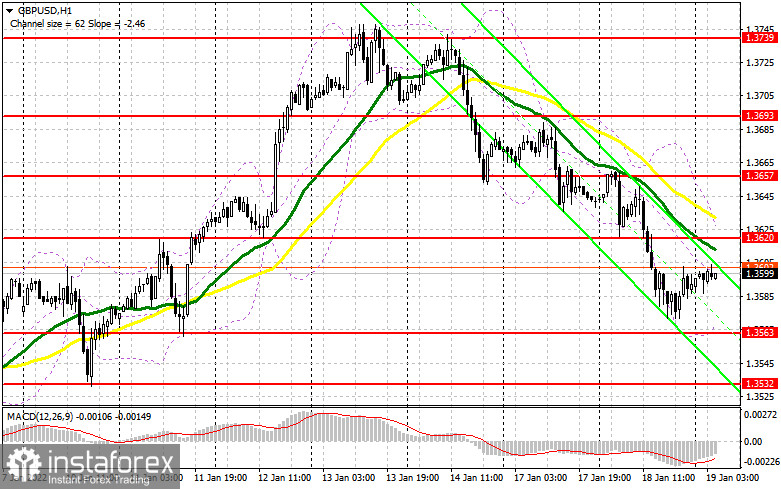
The main goal for today is to regain control of the resistance of 1.3620, where the moving averages are playing on the bears' side. An equally important task is also to protect the support of 1.3563, where you can count on the formation of divergence, which is now emerging on the MACD indicator. A false breakout at 1.3563 creates a buy signal with the prospect of a resumption of the bull market aimed at growth above 1.3620. Only a breakthrough and a test of this level from top to bottom will provide another entry point, which will strengthen the bulls' position in order to return to the highs: 1.3657 and 1.3693. The 1.3739 level is a more distant goal, where I recommend taking profits. In case GBP/USD falls further during the European session against the background of weak inflation and lack of activity at 1.3563, it is best to postpone long positions to the level of 1.3532, from where it will be possible to observe more aggressive actions from the bulls – this is their last chance to keep the market under their control in the short term. To miss this area is tantamount to missing the initiative. Forming a false breakout at 1.3532 will provide an entry point in hopes of further recovery of GBP/USD. You can buy the pound immediately on a rebound from 1.3496, or even lower - from a low like 1.3461, counting on a correction of 20-25 points within a day.
To open short positions on GBP/USD, you need:
Bears continue to push the market down, and if Bailey does not say anything new about monetary policy today, then the pressure on the pound may only intensify. The primary task is to protect the rather important resistance of 1.3620, just above which the moving averages are playing on the bears' side. Forming a false breakout at this level creates the first entry point into short positions against an upward trend, followed by a decline in the pair to the area of 1.3563. Weak data on inflation in the UK and taking control of this level will give a new entry point into short positions with the prospect of a decline in GBP/USD by 1.3532 and 1.3496, where I recommend taking profits. If the pair grows during the European session and bears are weak at 1.3620, it is best to postpone short positions until the next major resistance at 1.3657. I also advise you to open short positions there only in case of a false breakout. You can sell GBP/USD immediately for a rebound from 1.3693, or even higher - from this month's high in the area of 1.3739, counting on the pair's rebound down by 20-25 points within the day.
I recommend for review:
The Commitment of Traders (COT) reports for January 11 revealed that long positions had increased while short positions decreased - which indicates the pound's appeal after the Bank of England raised interest rates at the end of 2021. If you look at the overall picture, the prospects for the British pound look pretty good, and the observed downward correction makes it more attractive. The BoE's decisions continue to support buyers of risky assets in the expectation that the central bank will continue to raise interest rates this year, which will push the pound even higher. High inflation is still the main reason why the BoE will continue to tighten monetary policy. Last week, Federal Reserve Chairman Jerome Powell said that he would not shape events and rush to raise interest rates, especially in view of the sharp decline in retail sales in December 2021, which should cool down inflationary pressure a little. This led to a decrease in demand for the US dollar, which will allow pound bulls to continue building an upward trend. The COT report for January 11 indicated that long non-commercial positions increased from the level of 25,980 to the level of 30,506, while short non-commercial positions decreased from the level of 65,151 to the level of 59,672. This led to a change in the negative non-commercial net position from -39,171 to -29,166. The weekly closing price rose from 1.3482 to 13579.
Indicator signals:
Trading is below 30 and 50 moving averages, which indicates a downward correction in the pair.
Moving averages
Note: The period and prices of moving averages are considered by the author on the H1 hourly chart and differs from the general definition of the classic daily moving averages on the daily D1 chart.
Bollinger Bands
In case of growth, the upper border of the indicator around 1.3625 will act as resistance. In case of a decline, the lower border of the indicator in the area of 1.3565 will act as support.
Description of indicators
- Moving average (moving average, determines the current trend by smoothing out volatility and noise). Period 50. It is marked in yellow on the chart.
- Moving average (moving average, determines the current trend by smoothing out volatility and noise). Period 30. It is marked in green on the chart.
- MACD indicator (Moving Average Convergence/Divergence — convergence/divergence of moving averages) Quick EMA period 12. Slow EMA period to 26. SMA period 9
- Bollinger Bands (Bollinger Bands). Period 20
- Non-commercial speculative traders, such as individual traders, hedge funds, and large institutions that use the futures market for speculative purposes and meet certain requirements.
- Long non-commercial positions represent the total long open position of non-commercial traders.
- Short non-commercial positions represent the total short open position of non-commercial traders.
- Total non-commercial net position is the difference between short and long positions of non-commercial traders.