 English
  Русский
 Bahasa Indonesia
 Bahasa Malay
 ไทย
ไทย Español
 Deutsch
 Български
 Français
 Tiếng Việt
 中文
中文 বাংলা
বাংলা हिन्दी
 Čeština
 Українська
 Română

Trend analysis (Fig. 1).
The price from the level of 1.1326 (closing of yesterday's daily candle) is likely to start rising to the target of 1.1354 – the pullback level of 23.6% (yellow dotted line) today. Once this level is tested, it may further rise to the target of 1.1378 – the pullback level of 23.6% (yellow dotted line).
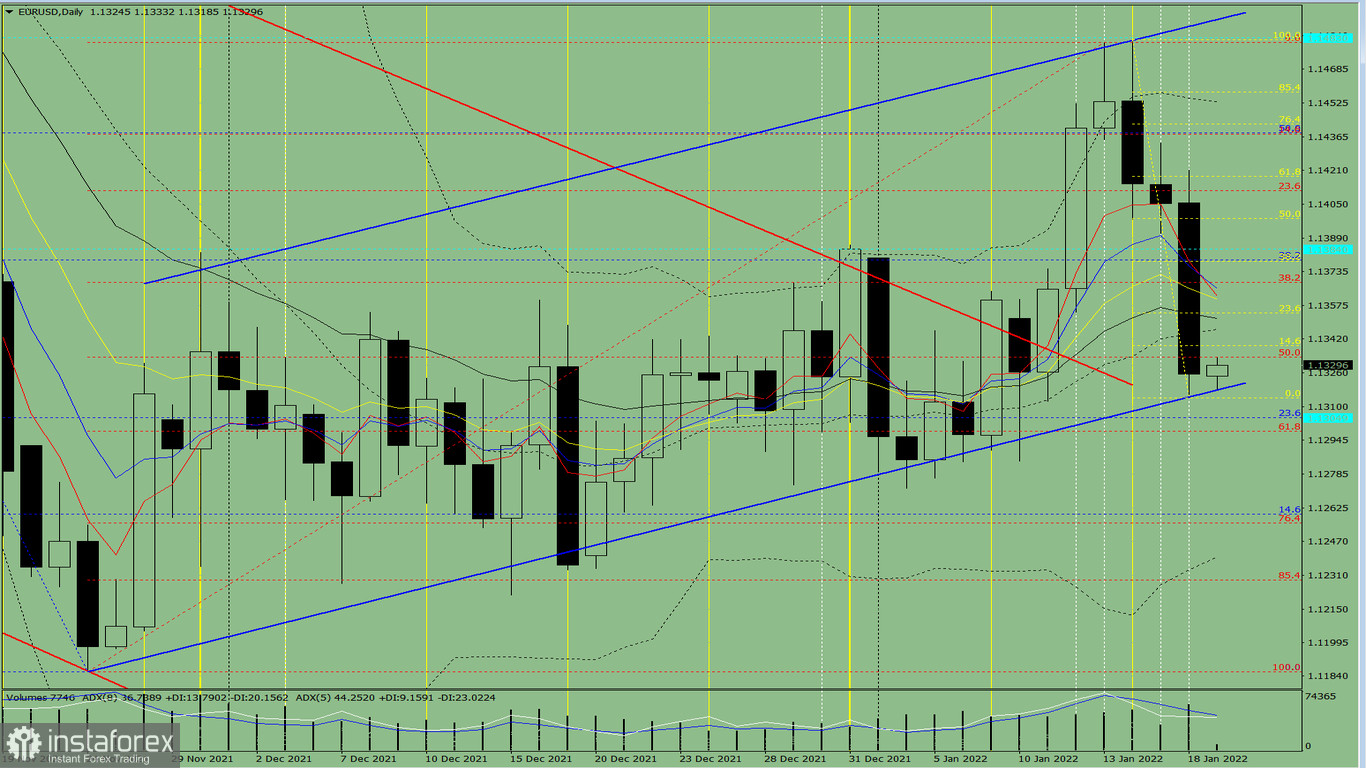
Fig 1 (daily chart)
Comprehensive analysis:
- Indicator analysis - up
- Fibonacci levels - up
- Volumes - up
- Candlestick analysis - up
- Trend analysis - up
- Bollinger bands - down
- Weekly chart - up
General conclusion:
Today, the price from the level of 1.1326 (closing of yesterday's daily candle) may begin its growth to the target of 1.1354 – the pullback level of 23.6% (yellow dotted line). After testing it, the upward movement may continue to the target of 1.1378 – the pullback level of 23.6% (yellow dotted line).
Alternatively, the price from the level of 1.1326 (closing of yesterday's daily candle) may continue to decline to the target of 1.1299 – the pullback level of 61.8% (red dotted line). After testing this level, it may now move up to the target of 1.1339 – the pullback level of 14.6% (yellow dotted line).