 English
  Русский
 Bahasa Indonesia
 Bahasa Malay
 ไทย
ไทย Español
 Deutsch
 Български
 Français
 Tiếng Việt
 中文
中文 বাংলা
বাংলা हिन्दी
 Čeština
 Українська
 Română

Trend analysis (fig. 1).
Today, the price may rebound from the level of 1.3591 (the closing of yesterday's daily candlestick) in order to reach the historical resistance level of 1.3618 (blue dotted line). If it breaks through this level, it is likely to approach the target level of 1.3677, the Fibonacci retracement level of 76.4% (yellow dotted line).
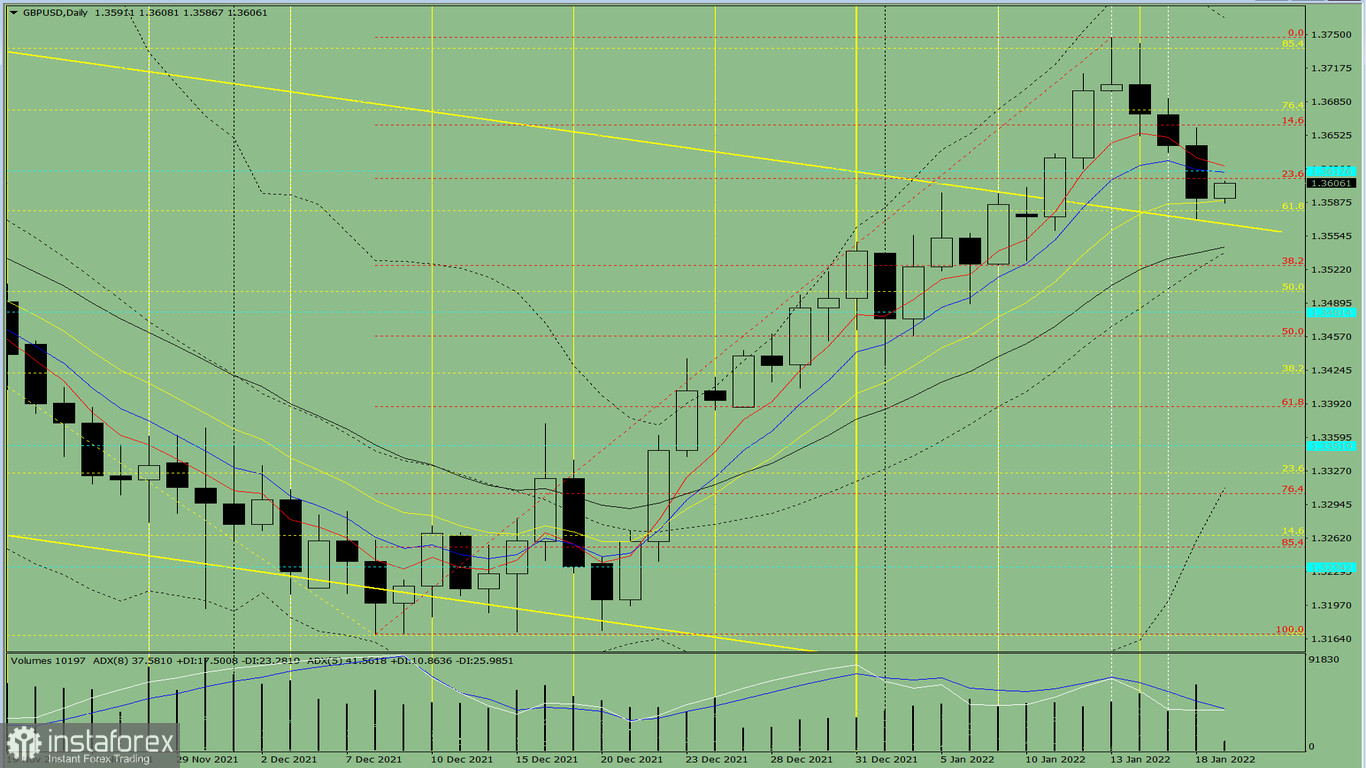
Fig. 1 (daily chart).
Complex analysis:
-indicator analysis– up;
- Fibonacci retracement levels - up;
- trading volumes - up;
- candlestick analysis - up;
- trend analysis - up;
- weekly chart - up;
- Bollinger bands - up.
Conclusion:
Today, the price may rebound from the level of 1.3591 (the closing of yesterday's daily candlestick) in order to reach the historical resistance level of 1.3618 (blue dotted line). If it breaks through this level, it is likely to approach the target level of 1.3677, the Fibonacci retracement level of 76.4% (yellow dotted line).
Alternatively, the price may decline from the level of 1.3591 (the closing of yesterday's daily candlestick) to the Fibonacci retracement level of 38.2%, 1.3526 (red dotted line). After testing this level, it is likely to resume an upward movement.