 English
  Русский
 Bahasa Indonesia
 Bahasa Malay
 ไทย
ไทย Español
 Deutsch
 Български
 Français
 Tiếng Việt
 中文
中文 বাংলা
বাংলা हिन्दी
 Čeština
 Українська
 Română

Here are the details of the economic calendar on January 19, 2021:
The only news in the macroeconomic calendar yesterday was the indicators on the UK labor market, which came out not bad at all. Here, the unemployment rate declined from 4.2% to 4.1%. At the same time, the number of applications for benefits in the period of December fell by 43.3 thousand, with a forecast of 38.6 thousand.
Only the employment data have a different result. It only rose by 60 thousand against the predicted growth of 125 thousand. Meanwhile, the growth of wages slowed down from 4.9% to 4.2%, which is noticeably worse than the forecast of 4.3%. This served as clear negativity in the report.
As a result, the overbought pound did not react in any way to the report on the labor market and continued to decline.
In terms of the information flow yesterday afternoon, reports began to arrive about a sharp increase in COVID-19 cases in Germany. This was the impetus for speculation in the market, which led to a sharp weakening of the euro.
Analysis of trading charts from January 18:
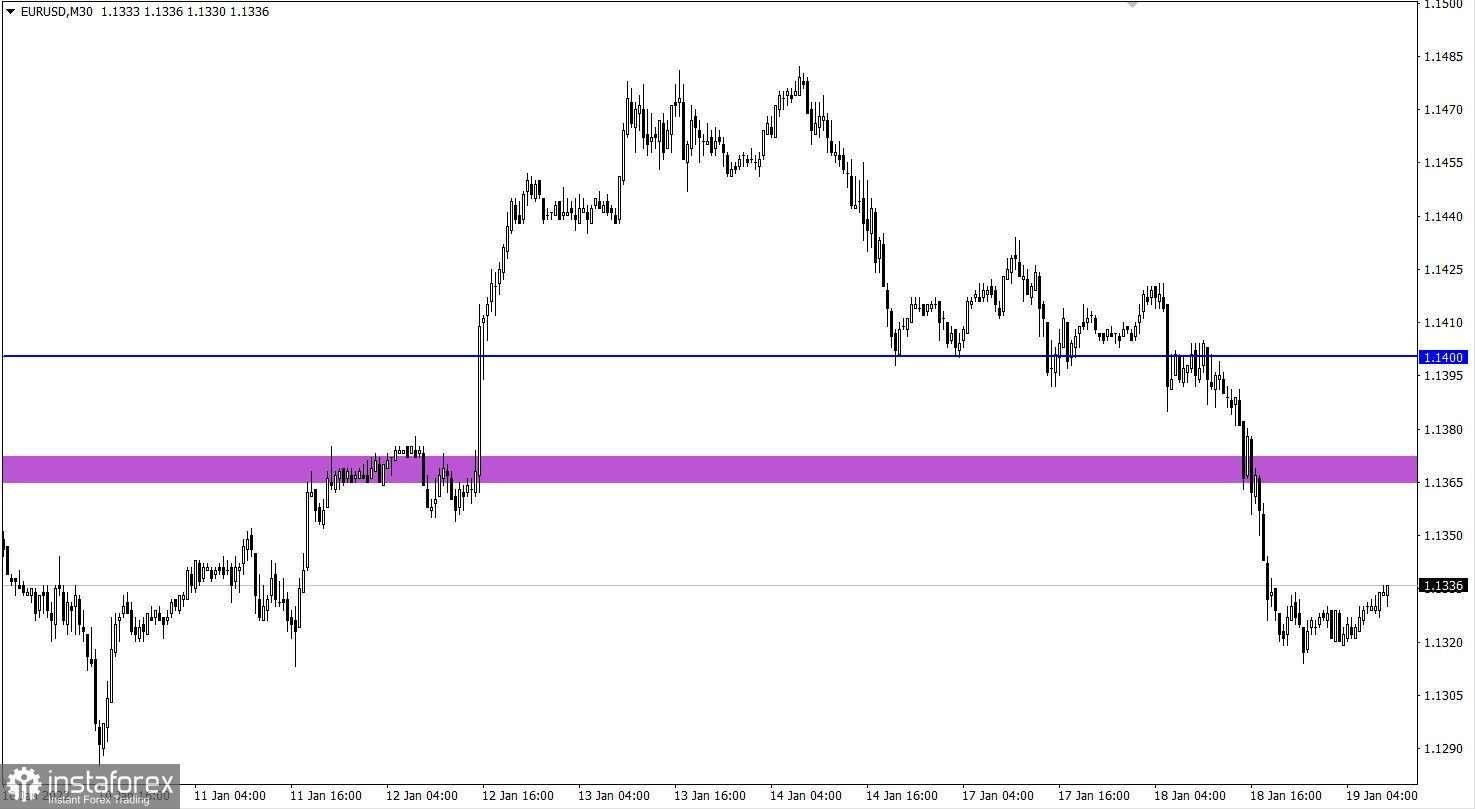
The EUR/USD pair strengthened its decline after holding the price below the level of 1.1400. This led to an inertial move towards 1.1314. The euro's scale of weakening for three trading days amounted to more than 150 points.
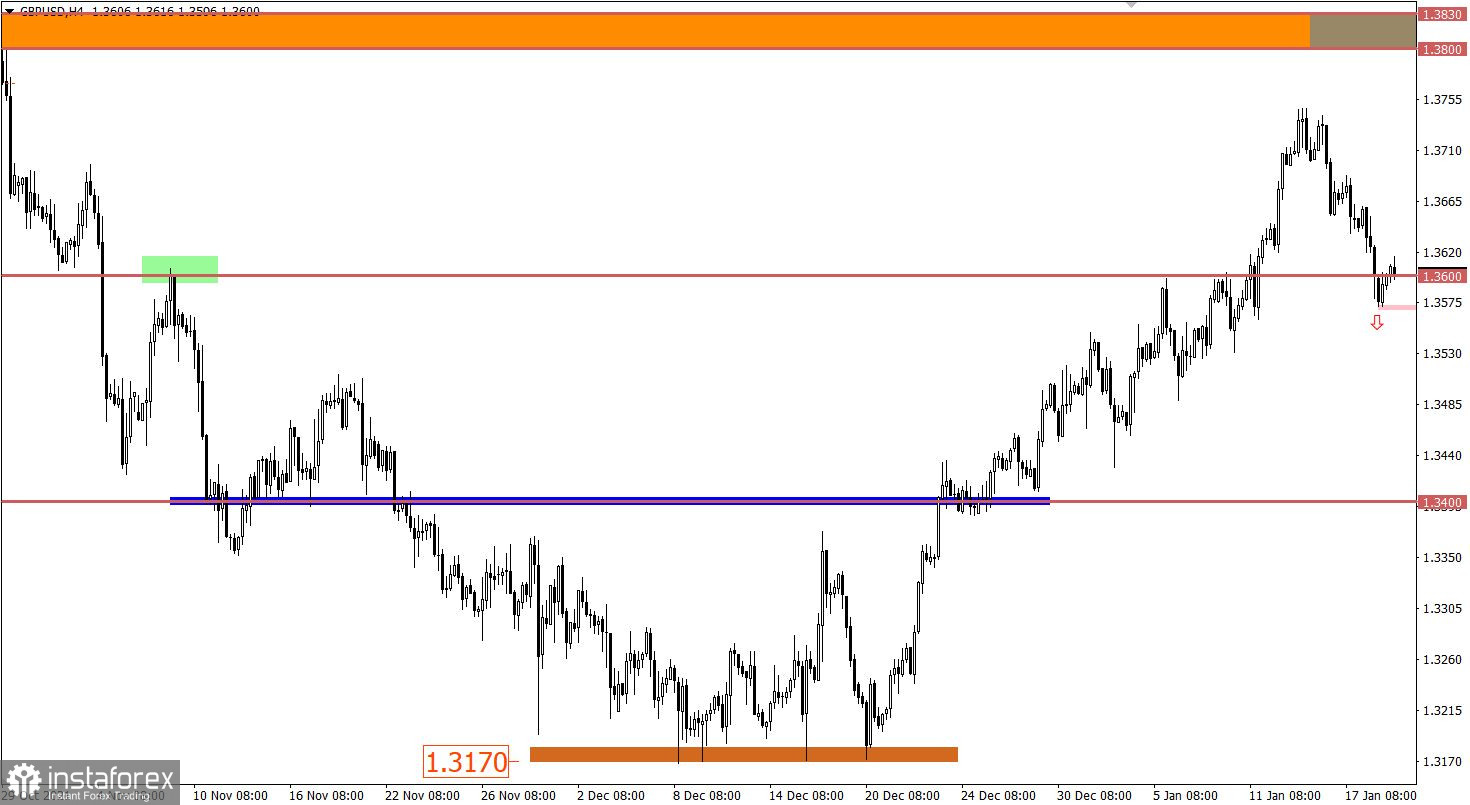
The downward movement of the GBP/USD pair returned the quote to the previously broken level of 1.3600. The pound's scale of weakening is comparable to a correction, which is acceptable given such a high level of overbought.
There is still a signal of a change in the medium-term trend on the daily chart, but to confirm it, the quote needs to stay above the level of 1.3850.

January 19 economic calendar:
The UK's inflation data was published today at 7:00 Universal time, where it rose from 5.1% to 5.4%, with a forecast of 5.2%. Rising consumer prices once again prove that the Bank of England will continue to raise interest rates.
During the US trading session, the construction sector data of the United States will be published. The number of building permits issued, as well as the volume of construction of new homes, is expected to fall.
This is not the best signal for the US economy, but it is still unknown whether this will be a signal for the US dollar to sell-off.
Time targeting
US construction sector data – 13:30 Universal time
Trading plan for EUR/USD on January 19:
There is currently a small pullback, which is more like a price stagnation in the range of 1.1310/1.1335. Therefore, it is worth considering an acceleration strategy, where the current stagnation will serve as a lever in the market.
We concretize the above details into trading signals:
Sell positions should be considered after holding the price above 1.1340 with the prospect of moving to 1.1370.
Sell positions should be considered after holding the price below 1.1310 with the prospect of moving to 1.1280.
Trading plan for GBP/USD on January 19:
In this situation, a stagnation-pullback relative to the level of 1.3600 is possible. This move is still considering the possibility of resuming upward inertia, which will lead to a complete change of trading interests.
At the same time, to prolong the correction, it is enough to stay below the level of 1.3570. This step will open up the possibility of a recovery move towards the level of 1.3450.
What is reflected in the trading charts?
A candlestick chart view is graphical rectangles of white and black light, with sticks on top and bottom. When analyzing each candle in detail, you will see its characteristics of a relative period: the opening price, closing price, and maximum and minimum prices.
Horizontal levels are price coordinates, relative to which a stop or a price reversal may occur. These levels are called support and resistance in the market.
Circles and rectangles are highlighted examples where the price of the story unfolded. This color selection indicates horizontal lines that may put pressure on the quote in the future.
The up/down arrows are the reference points of the possible price direction in the future.