 English
  Русский
 Bahasa Indonesia
 Bahasa Malay
 ไทย
ไทย Español
 Deutsch
 Български
 Français
 Tiếng Việt
 中文
中文 বাংলা
বাংলা हिन्दी
 Čeština
 Українська
 Română

At 13:30 UTC, the number of issued building permits in the United States will be published.
EURUSD, H4:
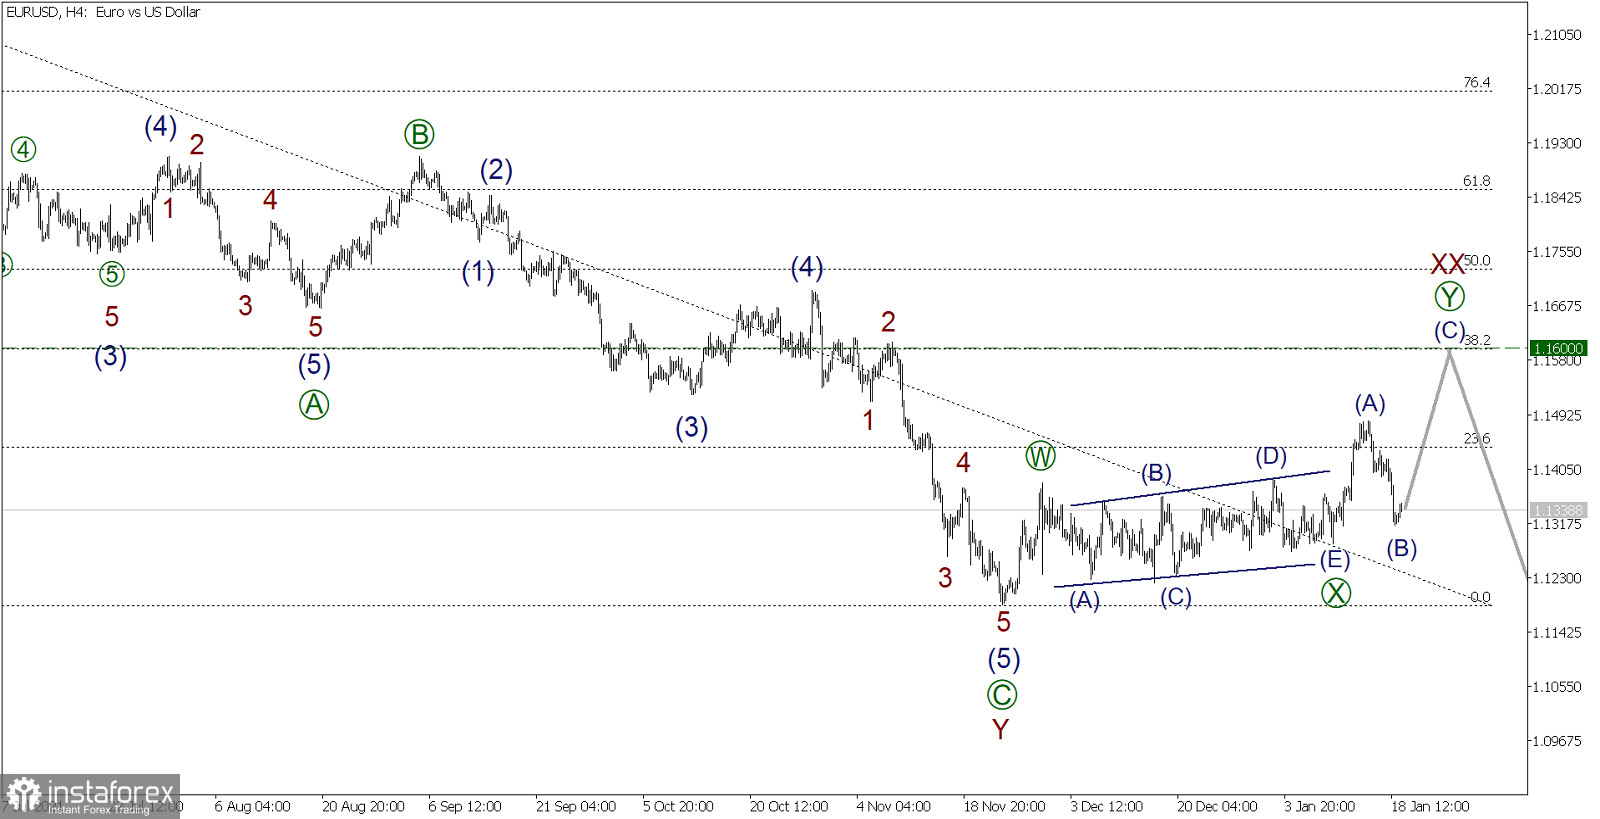
For the EURUSD currency pair on the 4-hour timeframe, we observe the formation of a downward corrective trend, which most likely takes the form of a triple zigzag W-X-Y-XX-Z.
In the last section of the chart, we see that the price decline in wave Y was completed, followed by an increase in wave XX. The wave bundle XX assumes a double zigzag [W]-[X]-[Y]. Perhaps the market has completed two subwaves of this double zigzag, that is, [W]-[X]. Wave [X] is similar to an sloping triangle, which is marked with subwaves (A)-(B)-(C)-(D)-(E).
We are currently in the active wave [Y], the initial part of which hints at a simple zigzag (A)-(B)-(C). In the near future, the price is expected to rise in impulse (C) to the level of 1.1600. At this level, the size of wave XX will be 38.2% of wave Y. The probability of achieving this coefficient is high.
In the current situation, it is possible to consider opening buy deals in order to take profit at the end of the impulse (C).
Investment decisions: buy 1.1338, take profit 1.1600.