 English
  Русский
 Bahasa Indonesia
 Bahasa Malay
 ไทย
ไทย Español
 Deutsch
 Български
 Français
 Tiếng Việt
 中文
中文 বাংলা
বাংলা हिन्दी
 Čeština
 Українська
 Română

First day of week: The EUR/USD pair's rise from the price of 0.9912 resumes today and accelerates to as high as 1.0030 so far. Immediate concentrate is now on 1.0046 resistance, which is close to 100-day EMA (now at 1 USD). Decisive break there argue that such rally is at least correcting the fall from 1.0030 to set at 1 USD. Also, it should be noted that U.S. inflation was 0.75% in November 2022, holding close to its highest annual rate in four decades despite easing energy costs. The EUR/USD pair retreated from around 1.0014, the 78% of Fibonacci retracement of the daily climb measured between 1.0046 and 0.9912, so holds above the former critical resistance, now support at 0.9912. Today, the EUR/USD pair has broken resistance at the level of 0.9912 which acts as support now. Thus, the pair has already formed minor support at 0.9912. The strong support is seen at the level of 0.9870 because it represents the weekly support 1.
Technical readings in the daily chart favor a bullish continuation, as indicators maintain their firmly bullish slopes within positive levels, while the 100 MA heads firmly higher below the current level. Equally important, the RSI and the moving average (100) are still calling for an uptrend. The RSI is becoming to signal an upward trend, as the trend is still showing strong above the moving average (100) and (50). On the hourly chart, the EUR/USD pair continues to test the strength of the resistance - the moving average line MA (100) H1 (1.0014). On the four-hour chart, the EUR/USD pair is also still above the MA 50 H4 line. Based on the above, it is probably worth sticking to the north direction in trading, and as long as the EUR/USD pair remains below MA 50 H1, it may be necessary to look for entry points to buy at the end of the correction. Therefore, the market indicates a bullish opportunity at the level of 0.9912 in the H1 chart. Also, if the trend is buoyant, then the currency pair strength will be defined as following: EUR is in an uptrend and USD is in a downtrend. Buy above the minor support of 0.9912 (this price is coinciding with the ratio of 50% Fibonacci) with the first target at 1.0046 and continue towards 1.0094 (the daily resistance 2).
On the other hand, if the price closes below the minor resistance, the best location for the stop loss order is seen below 0.9912; hence, the price will fall into the bearish market in order to go further towards the strong support at 0.9870 to test it again. On the downside, break of 0.9870 major support will suggest that such rebound has completed and bring retest of 0.9817 low instead. Furthermore, the level of 0.9731 will form a double bottom. If the pair succeeds in passing through the level of 0.9912, the market will indicate the bearish opportunity below the level of 0.9912 in order to reach the second target at 0.9817. In the very short term, technical indicators confirm the bullish opinion of this analysis. It is appropriate to continue watching any excessive bullish movements or scanner detections which might lead to a small bearish correction (0.9731).
Second day of week and third day : Uptrend.
he bullish trend is currently very strong for EUR/USD. As long as the price remains above the support at the level of 1 USD, it could try to take advantage of the bullish rally. The first bullish objective is located at 1.0102. Crossing it would then enable buyers to target 1.0143. Be careful, given the powerful bearish rally underway, excesses could lead to a short-term rebound. If this is the case, remember that trading against the trend may be riskier. It would seem more convenient to wait for a signal indicating reversal of the trend. The trend has closed above the pivot point (1.0042) could assure that EUR/USD will move higher towards cooling new highs. The bulls must break through 1.0042 in order to resume the uptrend. The EUR/USD pair is at an all-time high against the dollar around the spot of 1 USD since a month.
The EUR/USD pair is inside in upward channel. Closing above the major support (1.0042) could assure that EUR/USD will move higher towards cooling new highs. The EUR/USD pair is continuing rising by market cap at a range between 0.9946 and 1.0143. The EUR/USD pair is trading at 1 USD after it reached 1.0042 earlier. The EUR/USD pair has been set above the strong support at the price of 1 USD, which coincides with the 23.6% Fibonacci retracement level. This support has been rejected three times confirming the veracity of an uptrend. In the very short term, the general bullish sentiment is not called into question, despite technical indicators being neutral (RSI). The market is likely to show signs of a bullish trend around the spot of 1 USD. Buy orders are recommended above the area of 1 USD with the first target at the price of 1.0072; and continue towards 1.0102 in order to test the last bullish wave. The bullish momentum would be revived by a break in this resistance. Buyers would then use the next resistance located at 1.0143 as an objective.
The EUR/USD pair closed last week above the 1 USD level, starting today with bullish bias in attempt to move away from this level, which encourages us to propose the bullish bias in the upcoming sessions, targeting visiting 1.0143 as a first positive station. Further recovery should motivate the pair to challenge recent highs around 1.0143 to allow for extra gains to, initially, the interim hurdle at the 50-day EMA at 1.0042. The market is indicating a bullish opportunity above the above-mentioned support levels, for that the bullish outlook remains the same as long as the 50 EMA is headed to the upside Bias will be back on the upside for retesting 1.0143 high. On the upside, above 1 USD will resume the rebound to 1 USD resistance turned support. On the other hand, if the EUR/USD pair fails to break through the resistance price of 1.0042 today, the market will decline further to 1 USD (return to the last bearish wave).
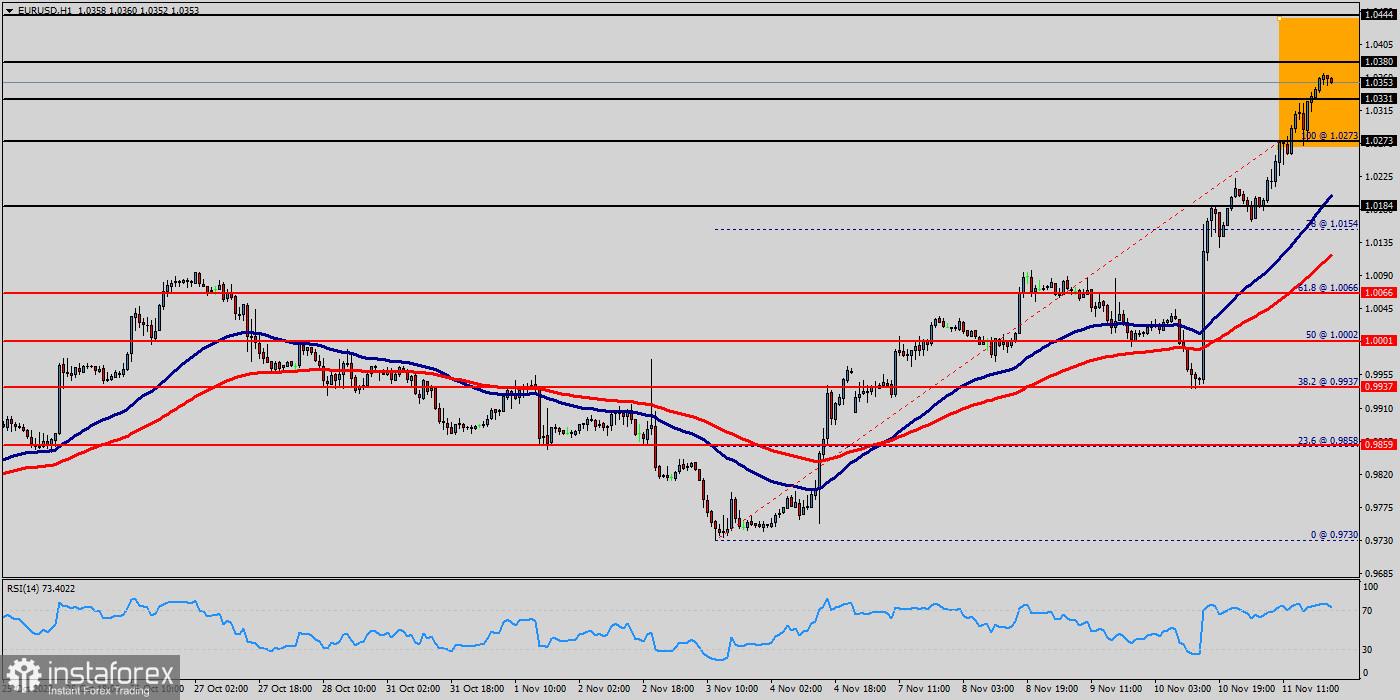
Forecast :
The pair will move upwards continuing the development of the bullish trend to the level 1.0011 - golden ratio 61.8%. Buy orders are recommended above the major's support rates of (1.0011) with the first target at the level of 1.0220. Furthermore, if the trend is able to breakout through the first resistance level of 1.0220. We should see the pair climbing towards the next target of 1.0260. It might be noted that the level of 1.0260 is a good place to take profit because it will form a new double top in coming hours. Overall, we still prefer the bullish scenario. Consequently, there is a possibility that the EUR/USD pair will move downside. The structure of a rise does not look corrective. Besides, the weekly resistance 2 is seen at the level of 1.0260. The market will climb further to 1.0300. This would suggest a bullish market because the RSI indicator is still in a positive area and does not show any trend-reversal signs. The pair is expected to rise higher towards at least 1.0300 in order to test the third support (1.0300) in coming hours. However, traders should watch for any sign of a bullish rejection that occurs around 1.0011.