 English
  Русский
 Bahasa Indonesia
 Bahasa Malay
 ไทย
ไทย Español
 Deutsch
 Български
 Français
 Tiếng Việt
 中文
中文 বাংলা
বাংলা हिन्दी
 Čeština
 Українська
 Română

Analyzing trades on Tuesday
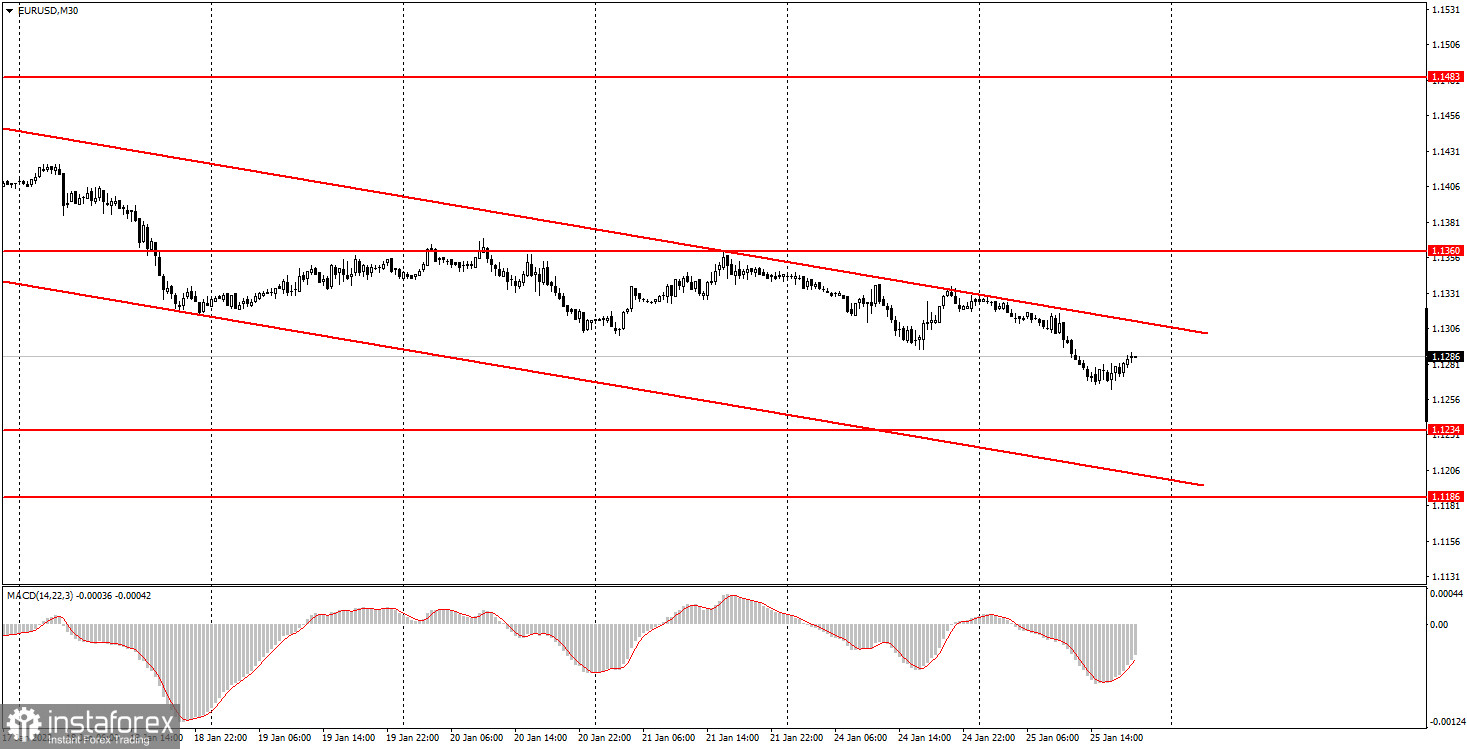
EUR/USD on 30M chart
The EUR/USD pair was trading slowly on Tuesday. It was hardly surprising since only one significant report was published during the day. However, the US consumer confidence index did not cause any reaction in the market. Thus, the economic calendar on Tuesday was almost empty. Nevertheless, the downtrend continues as the pair is gradually declining. Everything can change on Wednesday after the publication of the Fed's meeting results. We would like to remind beginners that this is one of the most important events for the foreign exchange market. Jerome Powell is expected to announce a $30 billion cut in the quantitative stimulus program. It is even possible that the regulator will raise the key rate this time. However, we still believe that the first meeting in 2022 will go smoothly without any unexpected results. The reaction of the market is very hard to predict.
EUR/USD on 5M chart

On the 5-minute time frame, the price movement looks quite good, as there were no sharp or frequent reversals during the day. This allowed us to trade calmly according to the existing levels, without checking the macroeconomic background, which was very weak on Tuesday. The first two sell signals were formed near the level of 1.1315. The price pulled back from them twice, so beginners should have opened short positions at this moment. Then the price dropped to the support area of 1.1285-1.1292 and overcame it on the second attempt. It continued to move down to the level of 1.1262 but missed just one pip to reach it, which is ok. The main thing is that the descending movement is still in place, which means that all sell signals have a higher priority. Following these signals, traders could open short positions with a full lot, while buy signals could be used with a half lot. Such a signal was formed when the price rebounded from the level of 1.1262. Subsequently, the pair returned to the area of 1.1285-1.1292 where it was possible to close long positions. As a result, novice traders could have earned about 50 pips during the day.
Trading tips on Wednesday
On the 30-minute time frame, the price has again entered the sideways channel between 1.1234 and 1.1360 which is located within the descending channel. In the near future, it will become clear whether the downtrend will continue or whether the pair will stay flat for a few more weeks. Currently, the price keeps rebounding from the upper line of the descending channel, so selling the pair seems more relevant now. On the 5-minute chart on Wednesday, we recommend trading at the levels of 1.1227-1.1234, 1.1262, 1.1285-1.1292, 1.1315, and 1.1360-1.1366. In general, there are quite a lot of levels on the chart now, which is typical of a flat movement. Therefore, you need to be careful when the price rebounds from these levels on the intraday chart. The main events on Wednesday will be the Fed meeting as well as the press conference with Jerome Powell. These events are scheduled for the late evening, so novice traders will have plenty of time to exit the market or place a Stop Loss.
Basic rules of the trading system
1) The strength of the signal is determined by the time it took the signal to form (a rebound or a breakout of the level). The quicker it is formed, the stronger the signal is.
2) If two or more positions were opened near a certain level based on a false signal (which did not trigger a Take Profit or test the nearest target level), then all subsequent signals at this level should be ignored.
3) When trading flat, a pair can form multiple false signals or not form them at all. In any case, it is better to stop trading at the first sign of a flat movement.
4) Trades should be opened in the period between the start of the European session and the middle of the US trading hours when all positions must be closed manually.
5) You can trade using signals from the MACD indicator on the 30-minute time frame only amid strong volatility and a clear trend that should be confirmed by a trendline or a trend channel.
6) If two levels are located too close to each other (from 5 to 15 pips), they should be considered support and resistance levels.
On the chart
Support and Resistance Levels are the levels that serve as targets when buying or selling the pair. You can place Take Profit near these levels.
Red lines are channels or trend lines that display the current trend and show in which direction it is better to trade now.
The MACD indicator (14, 22, and 3) consists of a histogram and a signal line. When they cross, this is a signal to enter the market. It is recommended to use this indicator in combination with trend patterns (channels and trendlines).
Important announcements and economic reports that can be found on the economic calendar can seriously influence the trajectory of a currency pair. Therefore, at the time of their release, we recommend trading as carefully as possible or exiting the market in order to avoid sharp price fluctuations.
Beginners on Forex should remember that not every single trade has to be profitable. The development of a clear strategy and money management is the key to success in trading over a long period of time.