 English
  Русский
 Bahasa Indonesia
 Bahasa Malay
 ไทย
ไทย Español
 Deutsch
 Български
 Français
 Tiếng Việt
 中文
中文 বাংলা
বাংলা हिन्दी
 Čeština
 Українська
 Română

Trend analysis (fig. 1).
Today, the pair may start rising from the level of 1.1300 (the closing of yesterday's daily candlestick) to the target level of 1.1347, the Fibonacci retracement level of 38.2% (yellow dotted line). After testing this level, the price is likely to approach the target level of 1.1373, the retracement level of 50.0% (yellow dotted line).
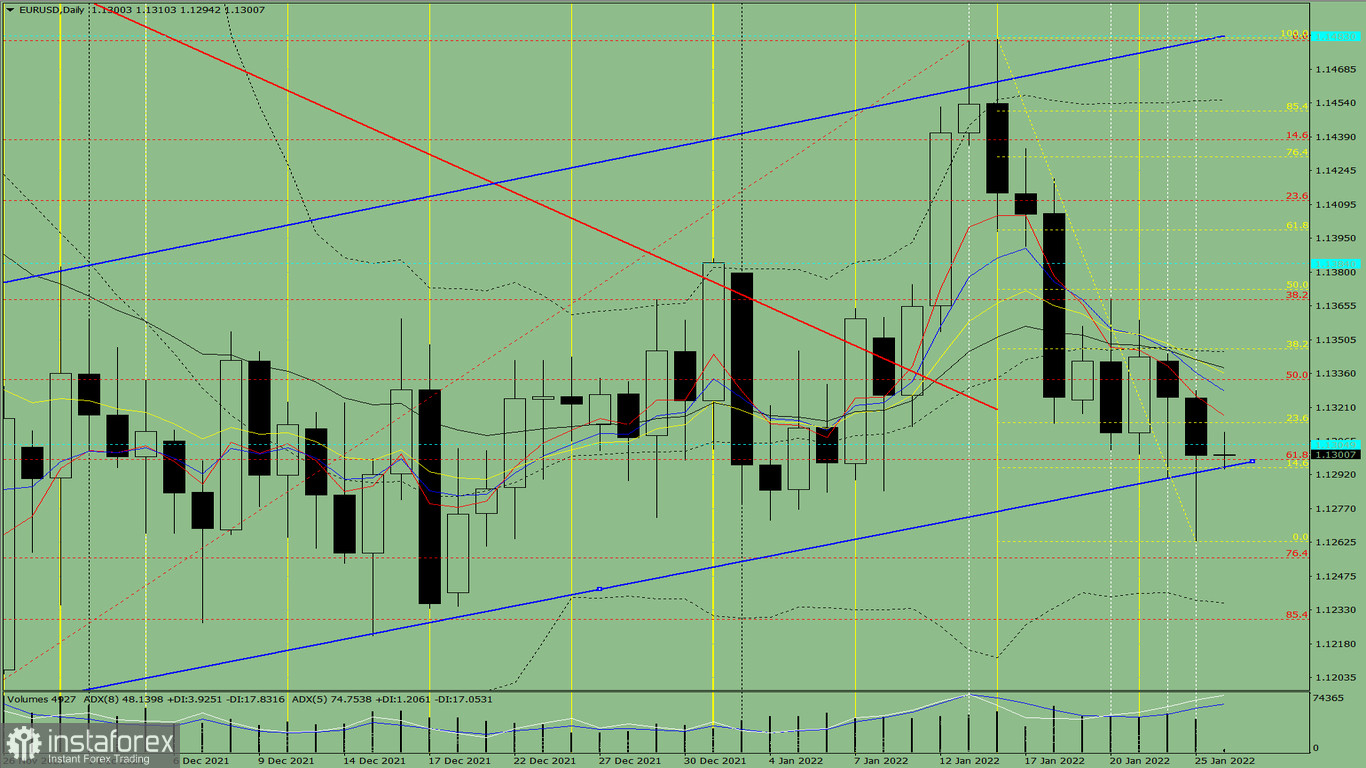
Fig. 1 (daily chart).
Complex analysis:
- indicator analysis – up;
Fibonacci levels - up;
- trading volumes - up;
- candlestick analysis - up;
- trend analysis - up;
- Bollinger bands - down;
- weekly chart-up.
Conclusion:
Today, the pair may start rising from the level of 1.1300 (the closing of yesterday's daily candlestick) to the target level of 1.1347, the Fibonacci retracement level of 38.2% (yellow dotted line). After testing this level, the price is likely to approach the target level of 1.1373, the retracement level of 50.0% (yellow dotted line).
Alternatively, the pair may decline from the level of 1.1300 (the closing of yesterday's daily candlestick) to the target level of 1.1263, the lower fractal (yellow dotted line). When testing this level, it has a chance to advance to the target level of 1.1295, which is the retracement level of 14.6% (yellow dotted line).