 English
  Русский
 Bahasa Indonesia
 Bahasa Malay
 ไทย
ไทย Español
 Deutsch
 Български
 Français
 Tiếng Việt
 中文
中文 বাংলা
বাংলা हिन्दी
 Čeština
 Українська
 Română

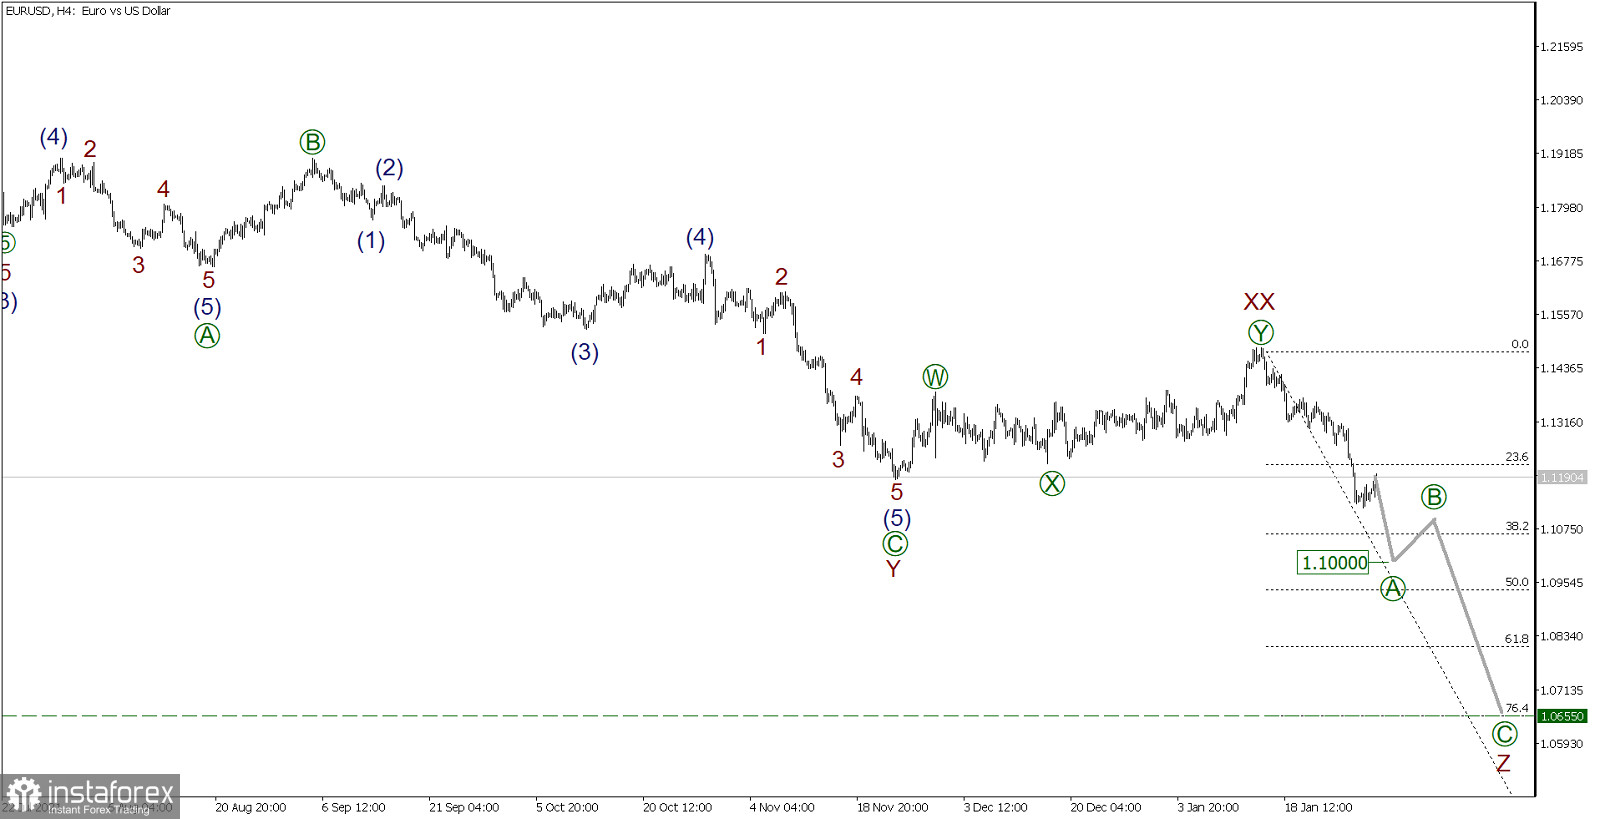
The last section of the chart on the four-hour timeframe for the EURUSD currency pair shows the internal structure of the downward wave Z. This wave is the final part in the global corrective pattern - the triple zigzag.
Most likely, wave Z will take the form of a standard zigzag [A]-[B]-[C], as shown in the chart. Full completion of this zigzag is expected around 1.065. The level is determined using the Fibonacci line tool. At the indicated level, the value of wave Z will be 76.4% of the previous active wave Y. The probability of reaching the specified coefficient is high.
In the short term, we can expect a fall to the level of 1.100, the end of the first impulse wave [A] is expected.
Thus, in the current situation, it is possible to consider longs in order to take profit at the specified level.
Trading recommendation: sell 1.1153, take profit 1.1000.