 English
  Русский
 Bahasa Indonesia
 Bahasa Malay
 ไทย
ไทย Español
 Deutsch
 Български
 Français
 Tiếng Việt
 中文
中文 বাংলা
বাংলা हिन्दी
 Čeština
 Українська
 Română

Trend analysis (Fig. 1).
The market may move up on Wednesday from the level of 1.3520 (close of yesterday's daily candle) to the target level of 1.3552, the 50.0% retracement level (blue dotted line). In case of testing this level, the price may move downwards to the target level of 1.3526, the 38.2% retracement level (red dotted line). On the news at 13:15 UTC, the price may resume its upward movement.
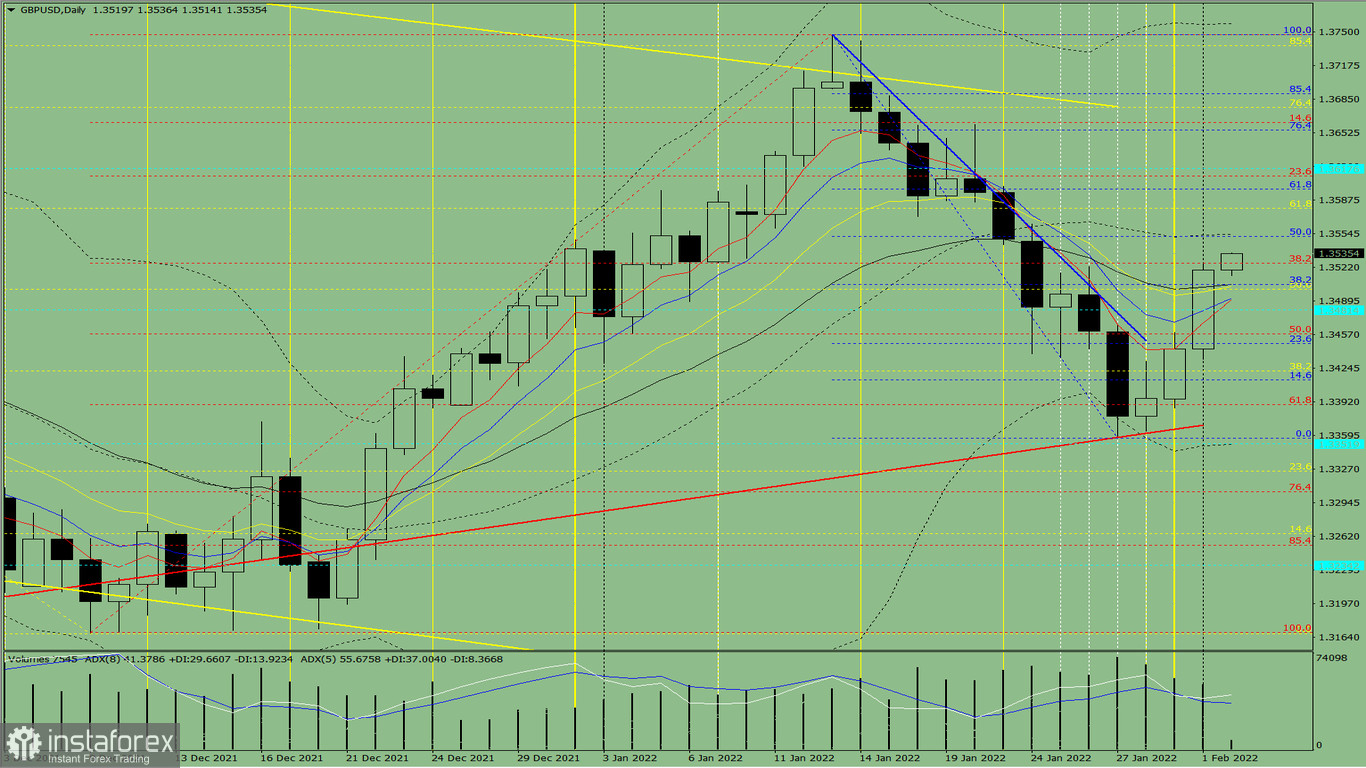
Fig. 1 (daily chart).
Comprehensive analysis:
- Indicator analysis - down;
- Fibonacci levels - down;
- Volumes - down;
- Candlestick analysis - down;
- Trend analysis - up;
- Weekly chart - up;
- Bollinger Bands – up.
General conclusion:
The price may move up today from the level of 1.3520 (close of yesterday's daily candle) to the target level of 1.3552, the 50.0% retracement level (blue dotted line). In case of testing this level, the price may move downwards to the target level of 1.3526, the 38.2% retracement level (red dotted line). On the news at 13:15 UTC, the price may resume its upward movement.
Unlikely scenario: from the level of 1.3520 (close of yesterday's daily candle), the price may start moving down to the target level of 1.3458, the 50% retracement level (red dotted line). In case of testing this level, the price may start moving upwards.