 English
  Русский
 Bahasa Indonesia
 Bahasa Malay
 ไทย
ไทย Español
 Deutsch
 Български
 Français
 Tiếng Việt
 中文
中文 বাংলা
বাংলা हिन्दी
 Čeština
 Українська
 Română

Trend analysis (Fig. 1).
The market may move down on Thursday from the level of 1.1303 (close of yesterday's daily candle) to test 1.1280, the 23.6% retracement level (red dotted line). Upon reaching this level, the price may start moving upwards to the target level of 1.1344, the 61.8% retracement level (yellow dotted line).
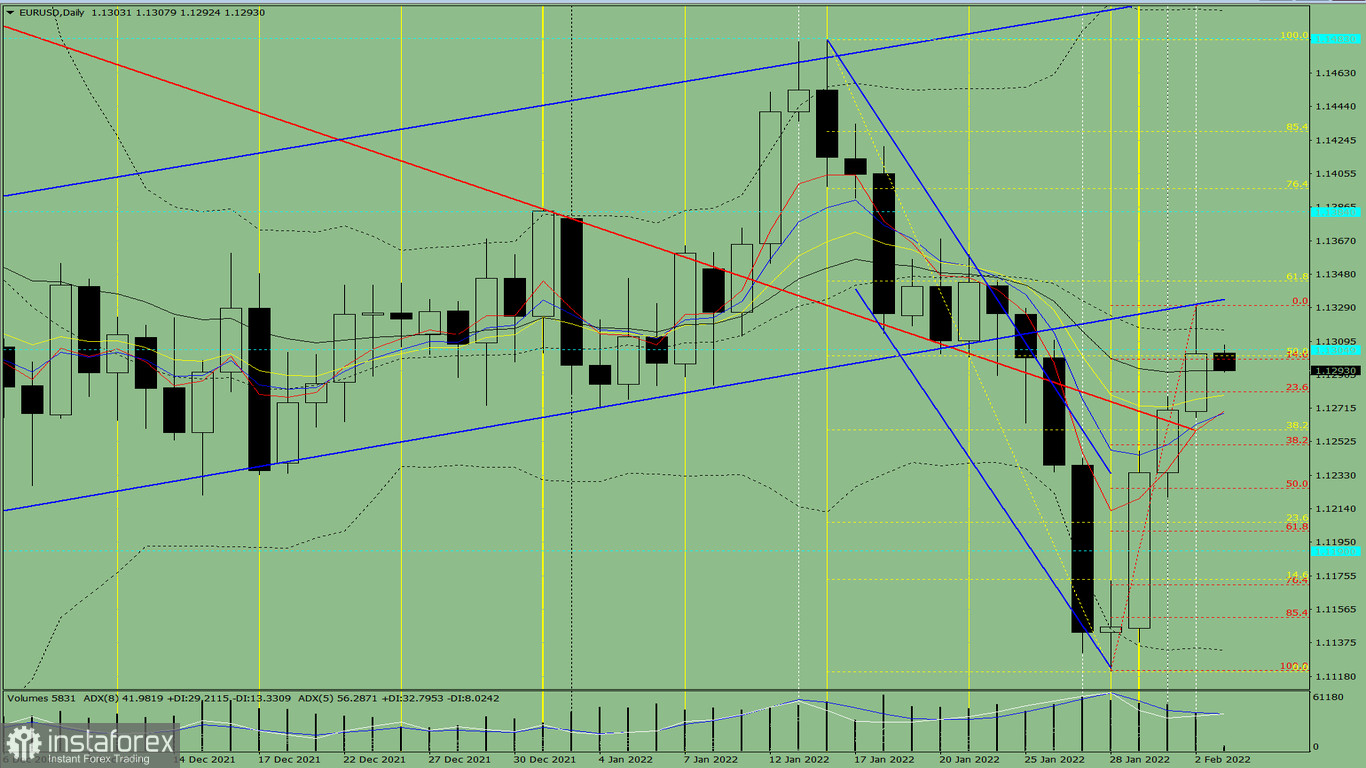
Fig. 1 (daily chart)
Comprehensive analysis:
- Indicator analysis - down;
- Fibonacci levels - down;
- Volumes - down;
- Candlestick analysis - down;
- Trend analysis - up;
- Bollinger bands - up;
- Weekly chart - up.
General conclusion:
The price may move down today from the level of 1.1303 (close of yesterday's daily candle) to test 1.1280, the 23.6% retracement level (red dotted line). Upon reaching this level, the price may start moving upwards to the target level of 1.1344, the 61.8% retracement level (yellow dotted line).
Alternative scenario: from the level of 1.1303 (close of yesterday's daily candle), the price may start to move down to test 1.1250, the 38.2% retracement level (red dotted line). Upon reaching this level, the price may start moving upwards to the target level of 1.1301, the 50.0% retracement level (yellow dotted line).