 English
  Русский
 Bahasa Indonesia
 Bahasa Malay
 ไทย
ไทย Español
 Deutsch
 Български
 Français
 Tiếng Việt
 中文
中文 বাংলা
বাংলা हिन्दी
 Čeština
 Українська
 Română

Trend analysis (Fig. 1).
The market may move up on Friday from the level of 1.1441 (close of yesterday's daily candle) to the upper fractal at 1.1482 (yellow dotted line). After testing this level, the upward movement may continue to the target level of 1.1510, the resistance line (blue bold line).
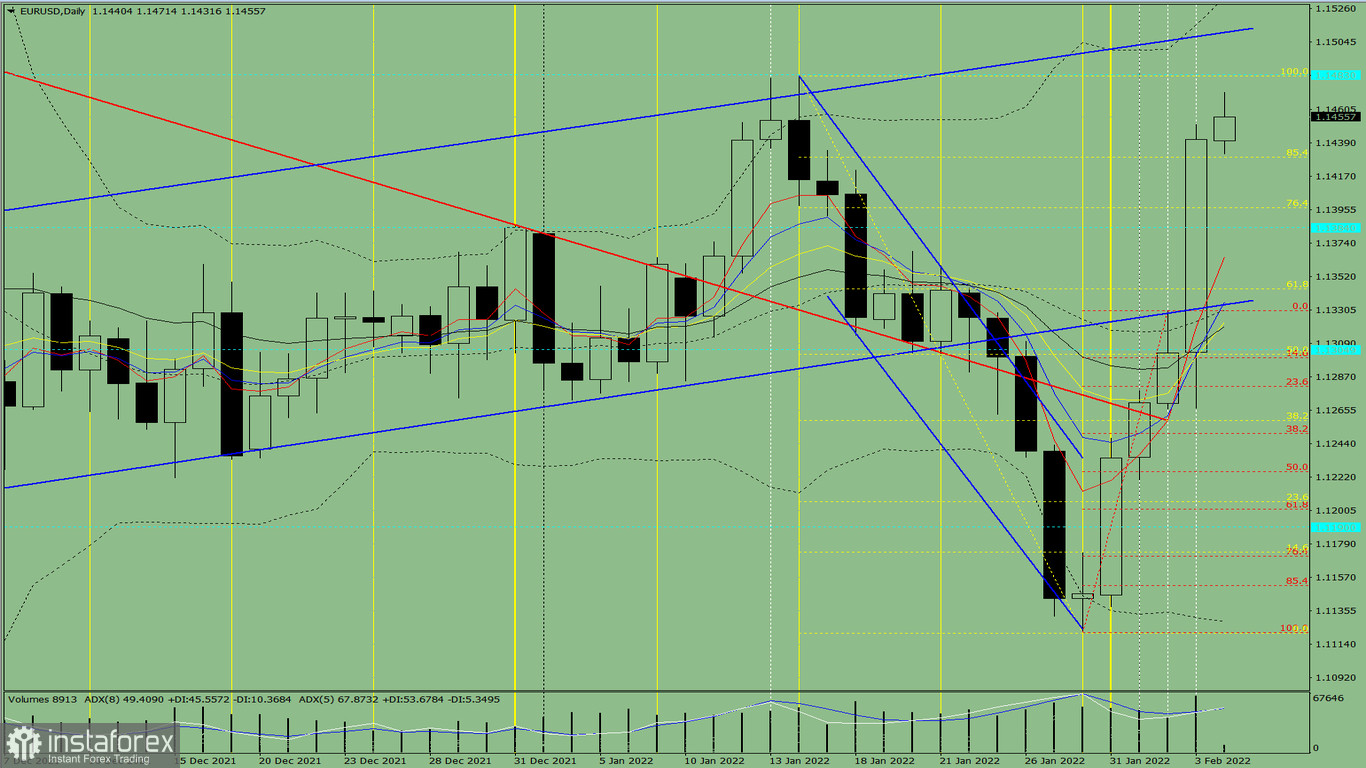
Fig. 1 (daily chart)
Comprehensive analysis:
- Indicator analysis - up;
- Fibonacci levels - up;
- Volumes - up;
- Candlestick analysis - up;
- Trend analysis - up;
- Bollinger bands - up;
- Weekly chart - up.
General conclusion:
The price may move upward from the level of 1.1441 (close of yesterday's daily candle) to the upper fractal at 1.1482 (yellow dotted line). After testing this level, the upward movement may continue to the target level of 1.1510, the resistance line (blue bold line).
Alternative scenario: from the level of 1.1441 (close of yesterday's daily candle), the price may continue to move upward to the upper fractal at 1.1482 (yellow dotted line). After testing this level, the price may start to move downward to the target level of 1.1380, the historical support level (blue dotted line).