 English
  Русский
 Bahasa Indonesia
 Bahasa Malay
 ไทย
ไทย Español
 Deutsch
 Български
 Français
 Tiếng Việt
 中文
中文 বাংলা
বাংলা हिन्दी
 Čeština
 Українська
 Română

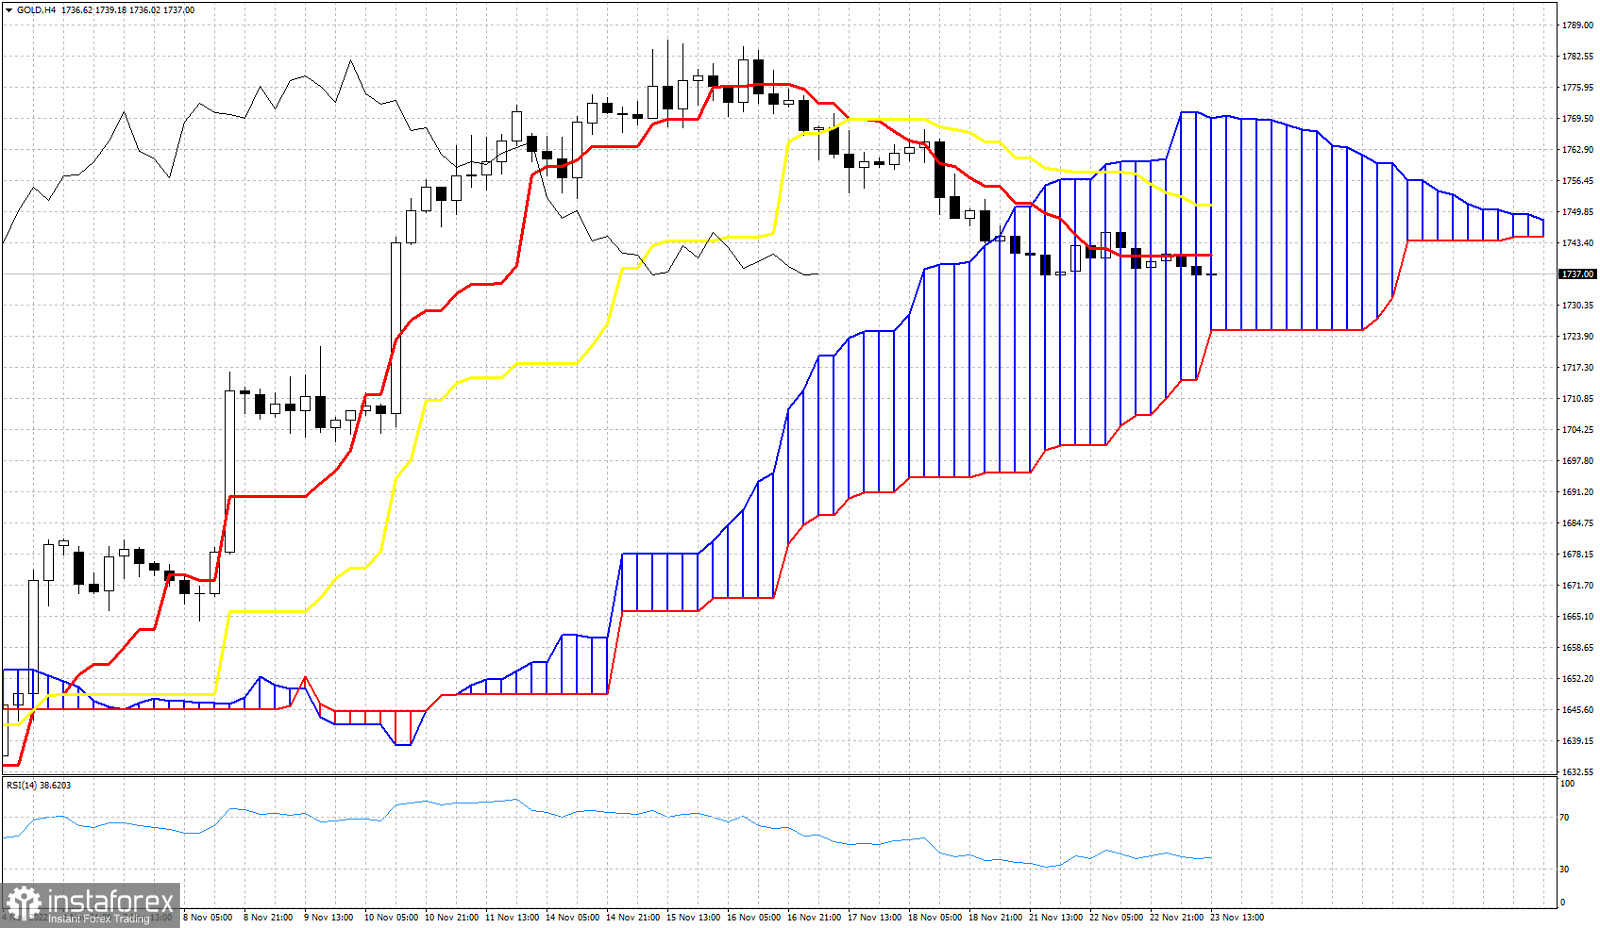
Gold price is trading around $1,740. In the 4 hour chart price remains inside the Kumo (cloud) and below the tenkan-sen (red line indicator). Price remains vulnerable to a pull back as initially expected from last week. Gold price is vulnerable to a move at least towards the lower cloud boundary at $1,725. Both the tenkan-sen and the kijun-sen (yellow line indicator) are above price. The Chikou span (black line indicator) is below the candlestick pattern. All indicators point to a move lower. A break above the cloud at $1,770 would change our short-term view. Until then we expect Gold price to continue lower. If Gold price breaks above the kijun-sen resistance at $1,751, then I would expect to see price test the upper cloud boundary at $1,770.