 English
  Русский
 Bahasa Indonesia
 Bahasa Malay
 ไทย
ไทย Español
 Deutsch
 Български
 Français
 Tiếng Việt
 中文
中文 বাংলা
বাংলা हिन्दी
 Čeština
 Українська
 Română

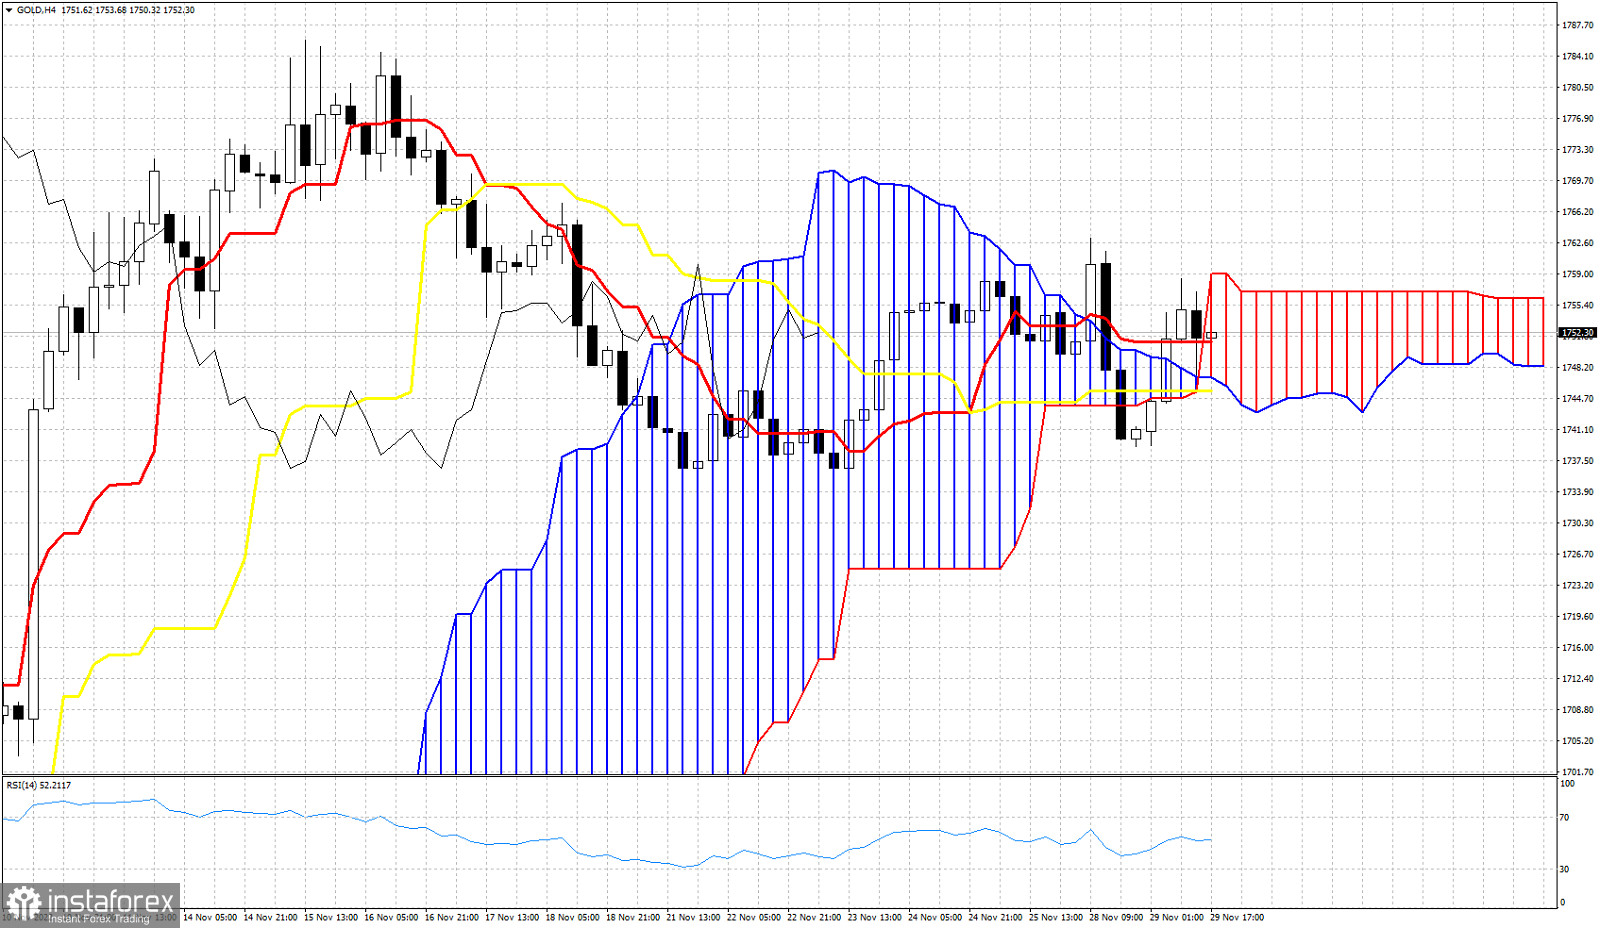
Gold price is trading around $1,750. Price has been very volatile over the last 24 hours as it has been bouncing up and down inside the range of $1,763 and $1,740. The indecisiveness can be clearly depicted by the Ichimoku cloud indicator in the 4 hour chart as price is moving above, below and inside the cloud in a very short time frame. We use today the Ichimoku cloud indicator to identify key support and resistance levels. Currently price is inside the Kumo (cloud). This implies trend is neutral. This agrees with the indecisiveness we talked about earlier. Support by the lower cloud boundary and the kijun-sen (yellow line indicator) is found at $1,745-47. Resistance is at the upper cloud boundary at $1,760. The Chikou span (black line indicator) above the candlestick pattern (bullish). Price is also above the tenkan-sen (red line indicator) and the kijun-sen (bullish also). If bulls manage to break above $1,760 and stay above it, then we could see the start of a new upward move that wll eventually push Gold above $1,800. Failure to hold above $1,740 will be a sign of weakness and we should then expect Gold to decline further towards $1,700.