 English
  Русский
 Bahasa Indonesia
 Bahasa Malay
 ไทย
ไทย Español
 Deutsch
 Български
 Français
 Tiếng Việt
 中文
中文 বাংলা
বাংলা हिन्दी
 Čeština
 Українська
 Română

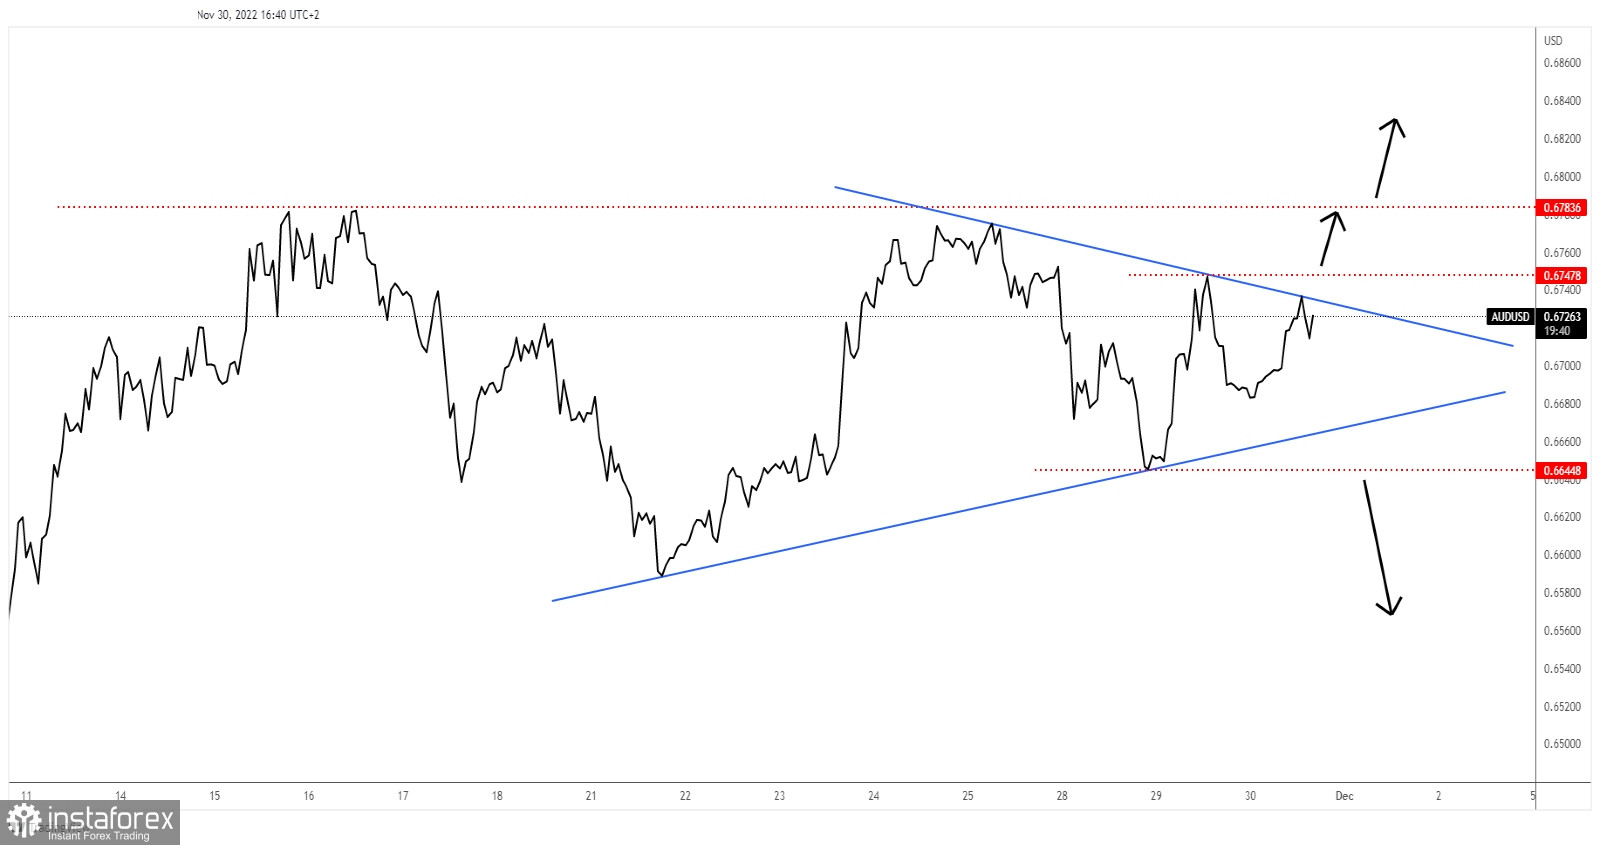
AUD/USD Triangle Pattern!
As you can see on the H1 chart, the rate moves sideways in the short term. Now, it has developed a triangle pattern. It's trapped between 0.6747 and 0.6644 levels. It's trading at 0.6726 at the time of writing.
Staying near the triangle's upside line may signal an imminent breakout. Still, as long as it stays below this line, AUD/USD could come back down at least towards the triangle's downside line and down to the 0.6644 level.
AUD/USD Trading Conclusion!
Jumping above 0.6747 signals an upside continuation while dropping below 0.6644 announces a deeper drop and helps the traders to catch a strong drop.