 English
  Русский
 Bahasa Indonesia
 Bahasa Malay
 ไทย
ไทย Español
 Deutsch
 Български
 Français
 Tiếng Việt
 中文
中文 বাংলা
বাংলা हिन्दी
 Čeština
 Українська
 Română

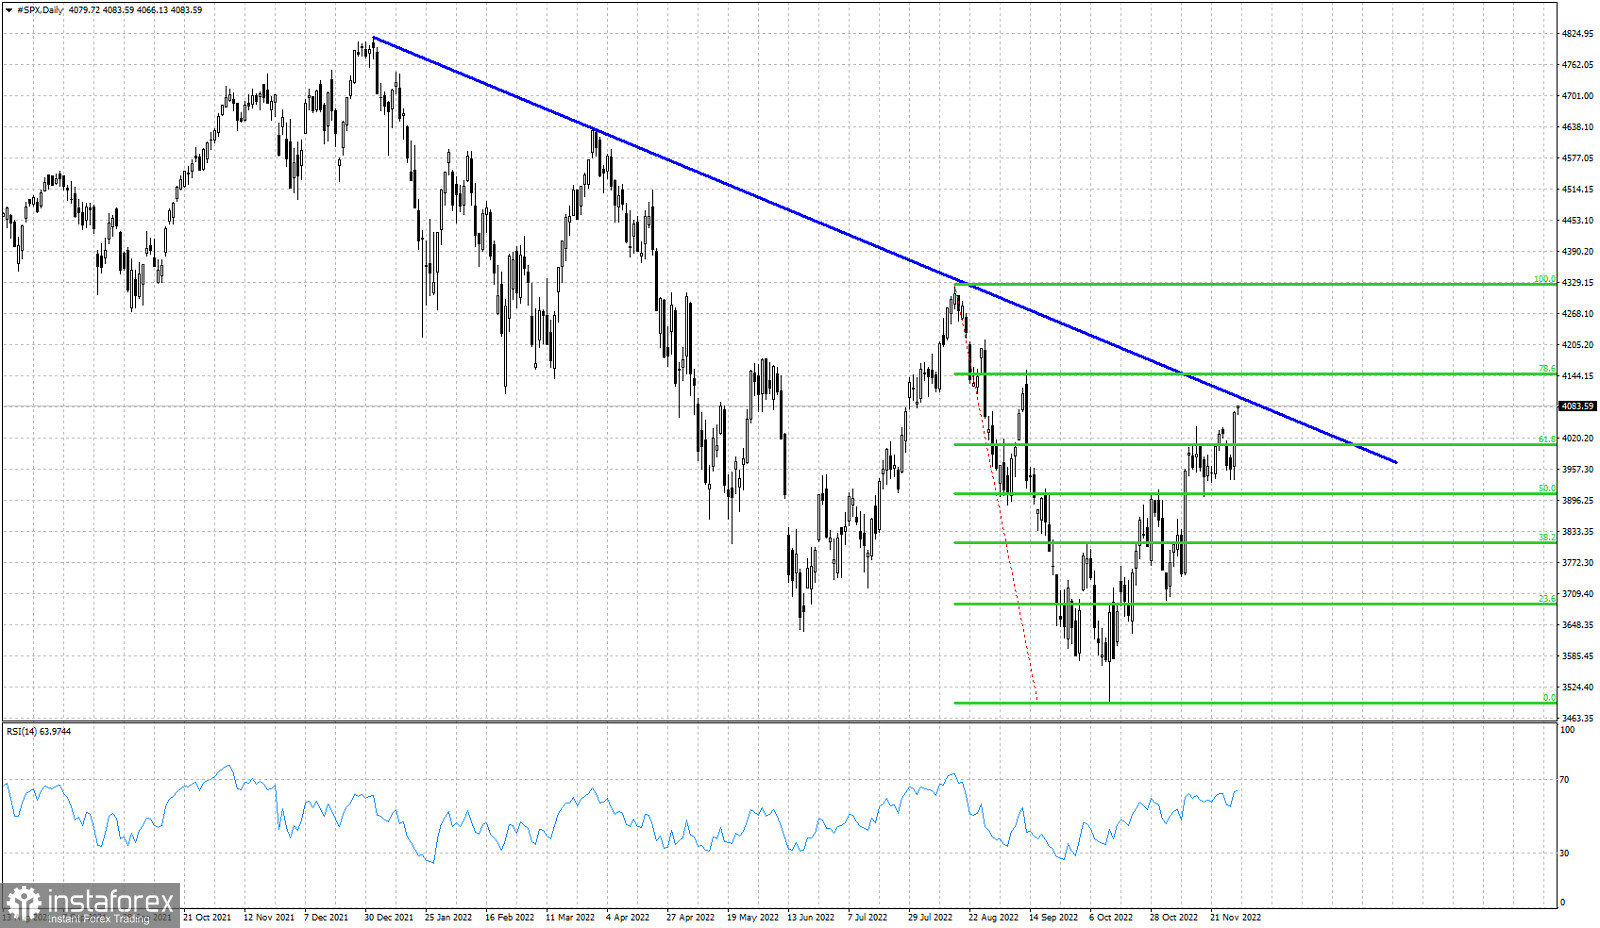
Blue line- resistance
Green lines- Fibonacci retracement levels
Short-term trend remains bullish for SPX as price continues making higher highs and higher lows. Price has now reached a very important resistance area. Price is challenging the blue downward sloping trend line that was already tested twice and the index got rejected. On the other hand price has broken above the 61.8% Fibonacci retracement which is a sign of strength. If the break above the 61.8% level is combined with a break of the trend line resistance at 4,100, then we will have a very strong bullish signal. The RSI is approaching overbought levels. The chances of a reversal are increasing as long as price does not break above the resistance. Both previous times price got rejected at the blue trend line the RSI did not move much higher than the 70 level. At the March top the RSI did not even pass above the 70 level into overbought territory. Support is found at recent low of 3,936, so bulls need to defend this level.