 English
  Русский
 Bahasa Indonesia
 Bahasa Malay
 ไทย
ไทย Español
 Deutsch
 Български
 Français
 Tiếng Việt
 中文
中文 বাংলা
বাংলা हिन्दी
 Čeština
 Українська
 Română

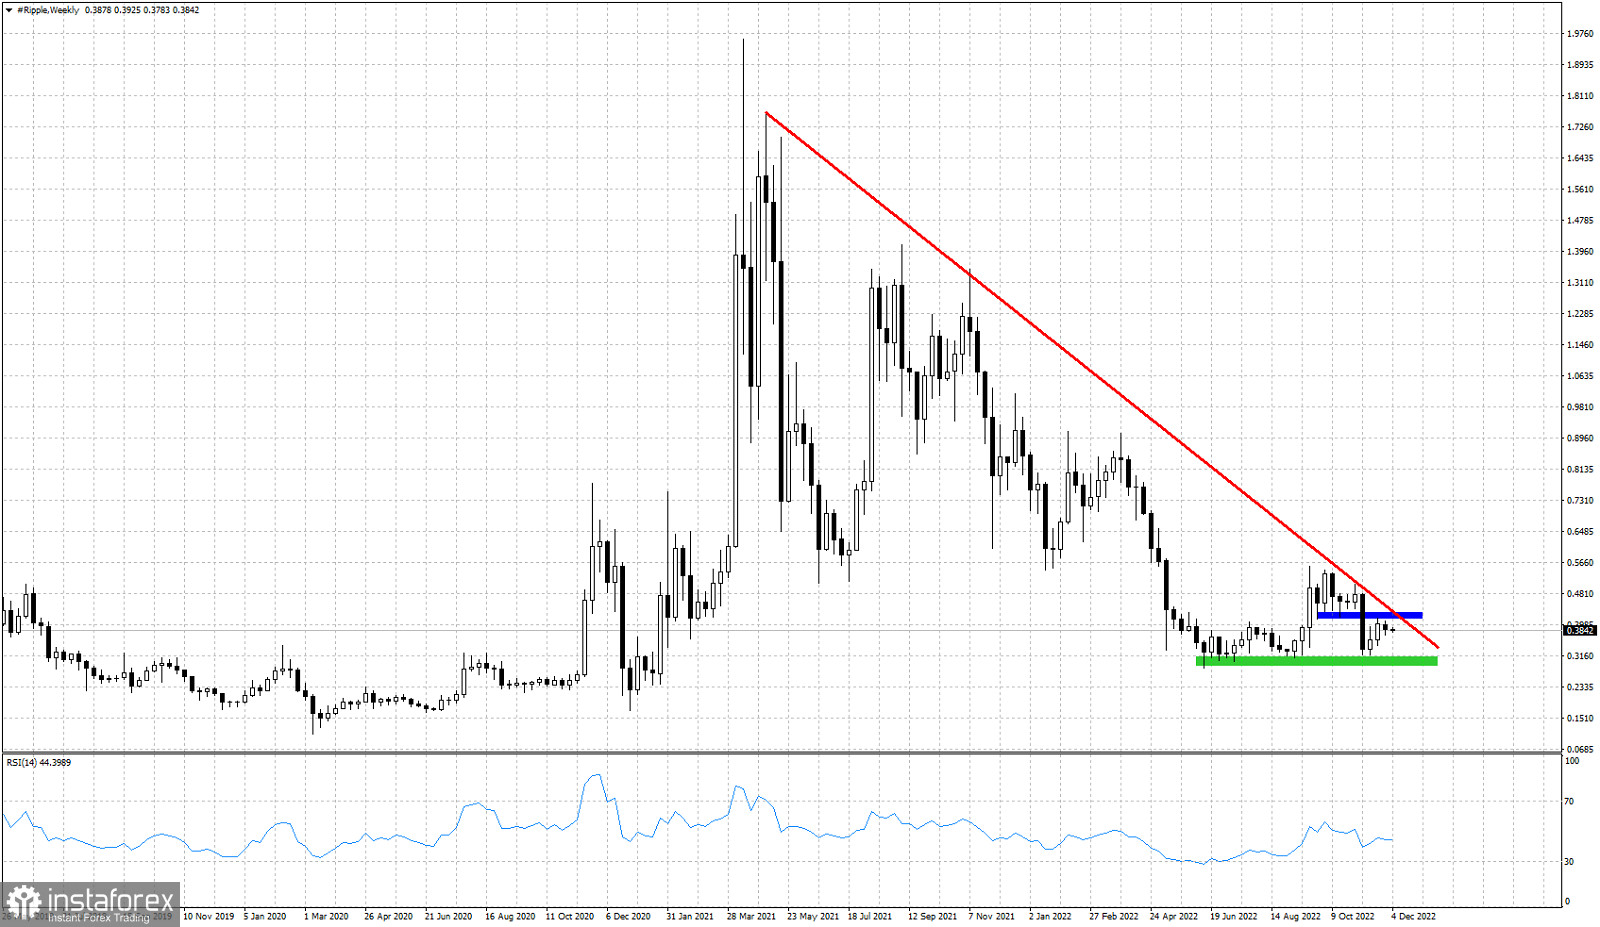
Red line -long-term resistance trend line
green rectangle- horizontal support
Blue rectangle- horizontal resistance
XRPUSD is trading around $0.3844 as price remains under pressure and under the control of the bears. Over the last few months, price has made no real progress as it mostly moved sideways. We saw prices spike in August but the bounce was not strong enough for price to break above key resistance trend lines. Resistance is now found at $0.42-$0.43 where a confluence of horizontal resistance and trend line resistance meets. Support remains key at $0.30-$0.29. A break below this level could lead to another sell off towards $0.15. Bulls need to break above the red trend line resistance and the blue horizontal resistance area in order to gain some bullish momentum.