 English
  Русский
 Bahasa Indonesia
 Bahasa Malay
 ไทย
ไทย Español
 Deutsch
 Български
 Français
 Tiếng Việt
 中文
中文 বাংলা
বাংলা हिन्दी
 Čeština
 Українська
 Română

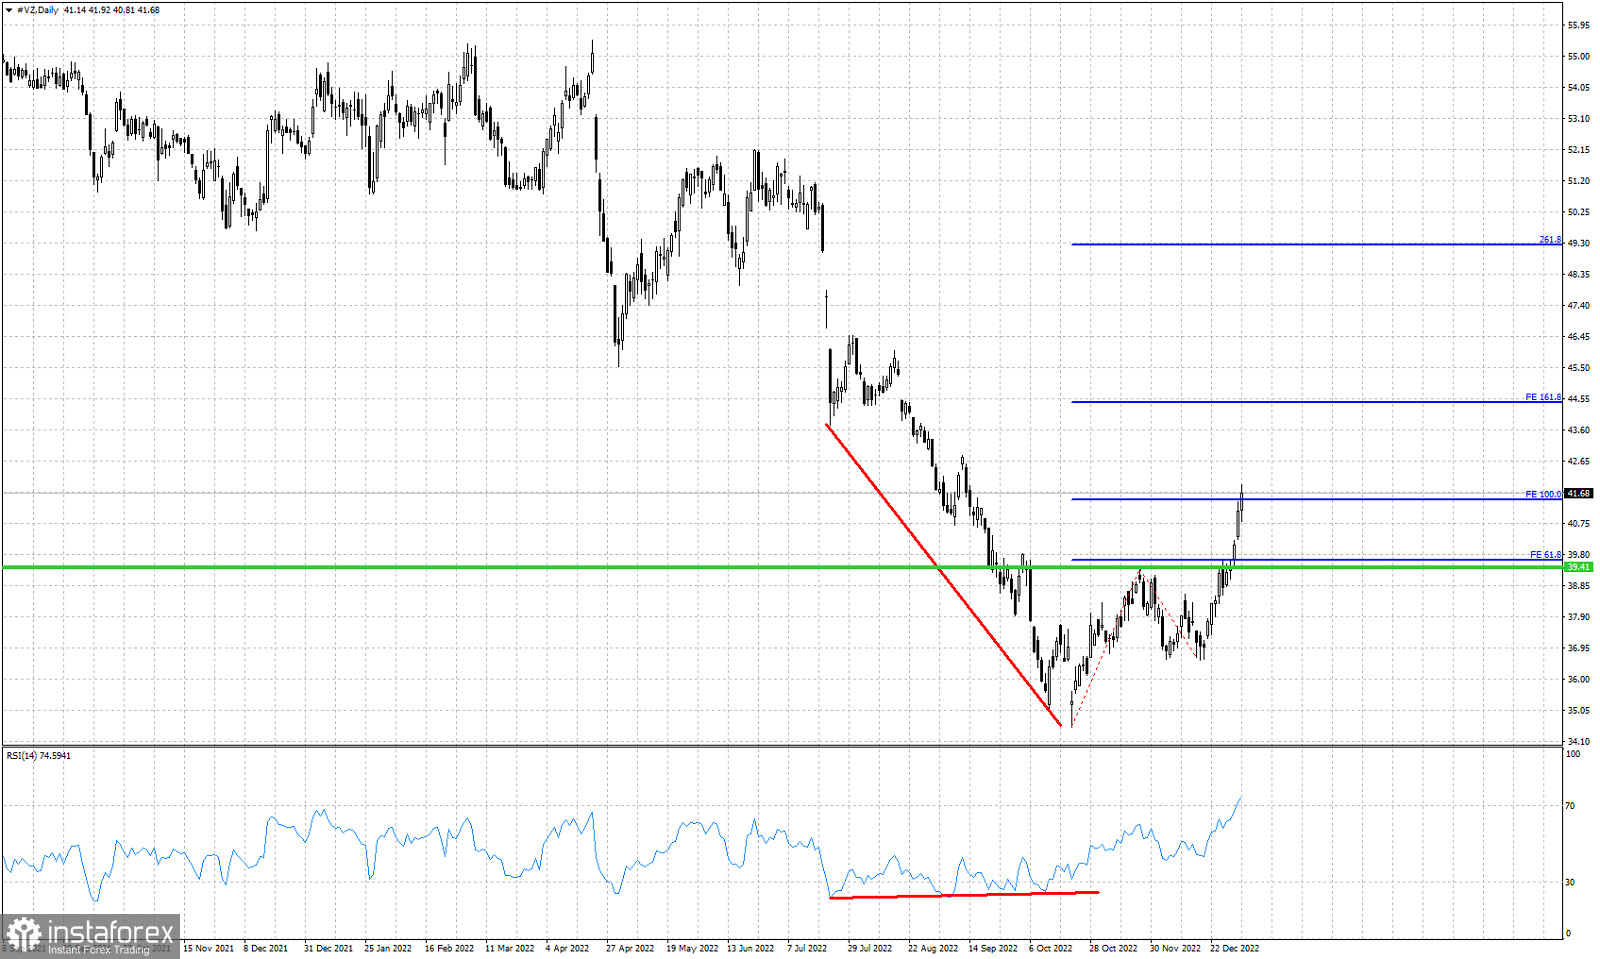
Green line -horizontal resistance (broken)
Red lines- bullish divergence
Blue lines- Fibonacci extension targets
In our last analysis on VZ stock price we noted that there was a bullish pattern in play. We mentioned that a break above the horizontal resistance of $39.40-$39.50 would be a bullish signal with $41.45 the first target. After the break out our 100% extension target has been reached. Support remains key at $36.57 and as long as we trade above this level, bulls have hopes for higher highs. Previous resistance at $39.50 is now support. It would be a sign of weakness if price were to break back below this level. Traders who entered long when price broke above the $39.50 resistance, should protect their positions at break even.