 English
  Русский
 Bahasa Indonesia
 Bahasa Malay
 ไทย
ไทย Español
 Deutsch
 Български
 Français
 Tiếng Việt
 中文
中文 বাংলা
বাংলা हिन्दी
 Čeština
 Українська
 Română

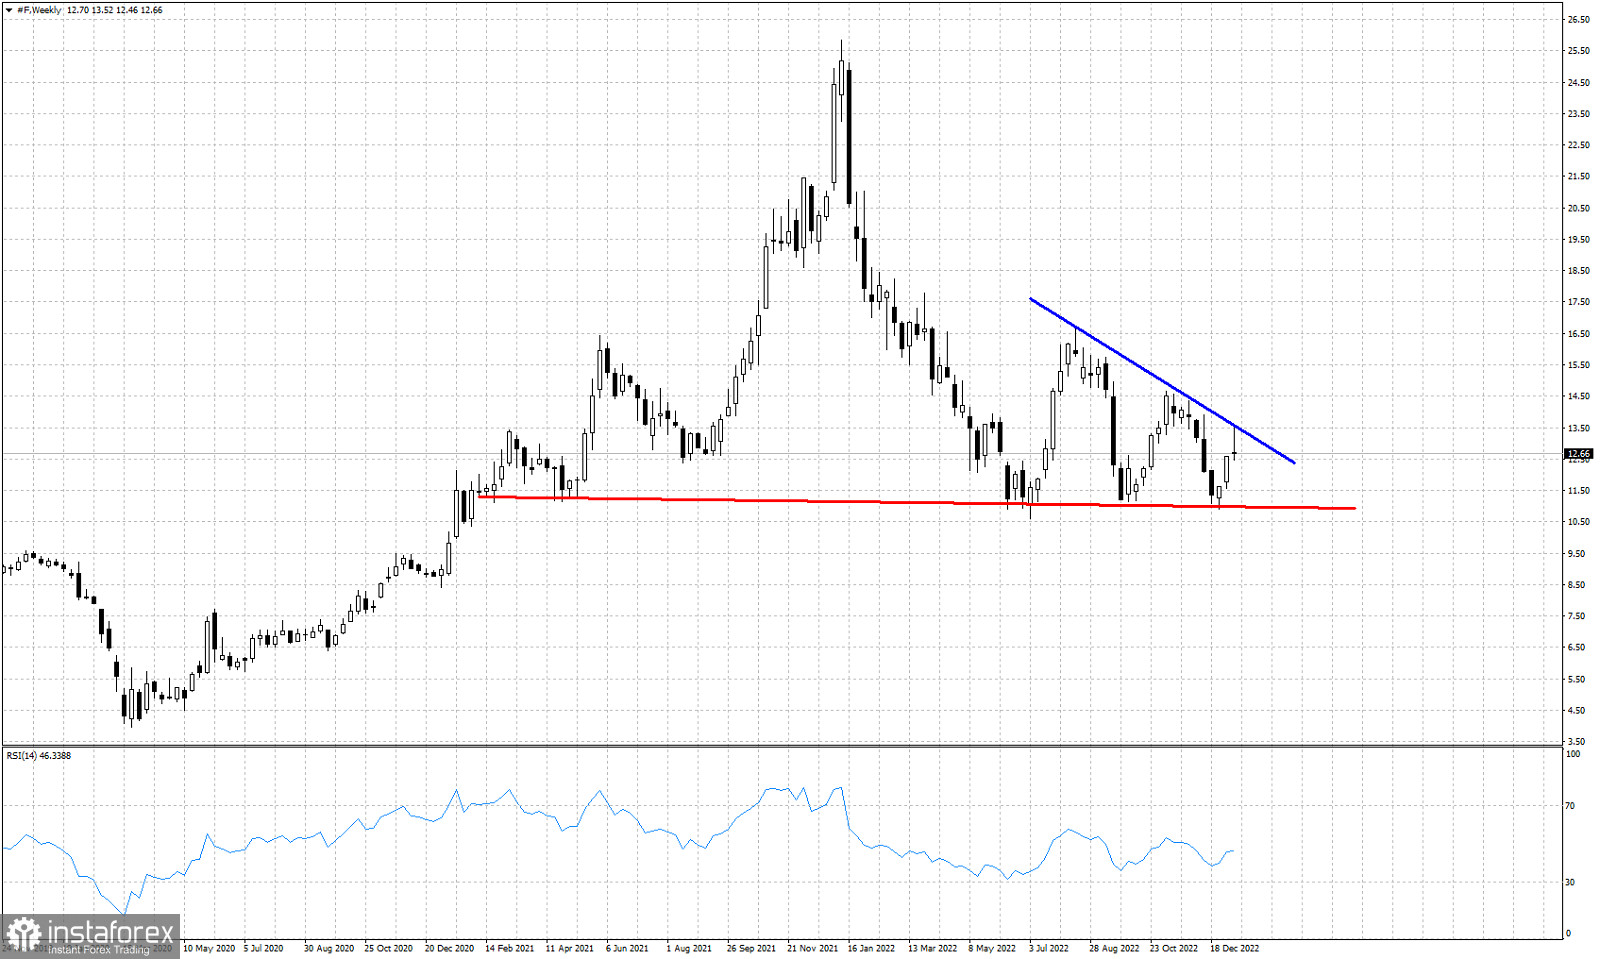
Red line- support
Blue line- resistance
Ford stock price is trading around $12.61. In our previous analysis when price was bouncing off the key horizontal support of $11 we mentioned that we should expect the bounce to at least reach the resistance of $13.70. Price this week made a high very close to the resistance trend line at $13.50 and got rejected. Price remains below the key resistance trend line that has already provided two major pull backs towards $11. A break above the blue trend line would be a bullish signal for Ford stock. This week's candle with the long upper tail is not good for bulls. If next week price remains under pressure, we should not be surprised to see it reach $11 again.