 English
  Русский
 Bahasa Indonesia
 Bahasa Malay
 ไทย
ไทย Español
 Deutsch
 Български
 Français
 Tiếng Việt
 中文
中文 বাংলা
বাংলা हिन्दी
 Čeština
 Українська
 Română

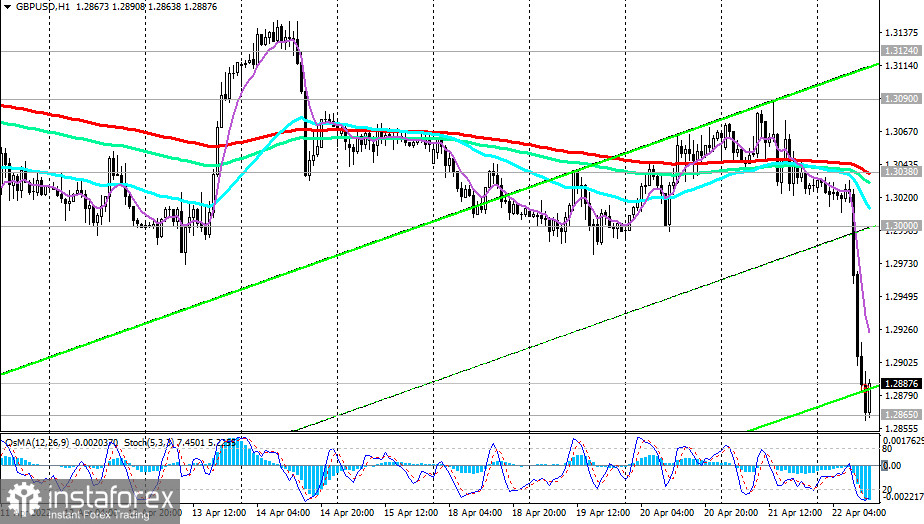
The GBP/USD pair updated the low of November 2020 on Friday and hit an intraday low near 1.2865.
We have set this target in our review last April 12 and as you can see, the target has been achieved. At the same time, the negative dynamics of the pair continue both on the weakness of the pound, and against the backdrop of the dollar continuing to strengthen. Yesterday, Federal Reserve Chairman Jerome Powell gave an additional impetus for growth during his speech at an IMF meeting in Washington.
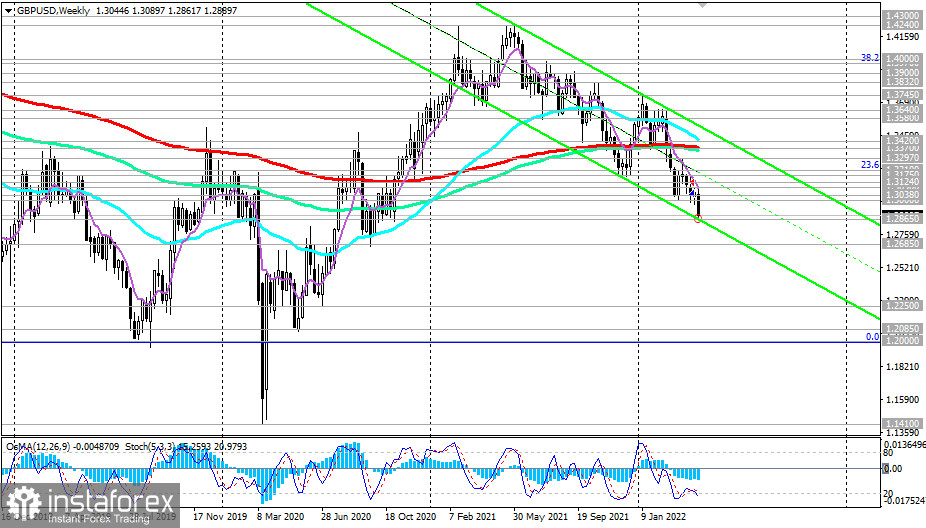
Our main scenario still assumes a decline in GBP/USD. The signal for the resumption of short positions may be a breakdown of today's minimum and the local support level of 1.2865 (the lower limit of the descending channel on the weekly chart). A breakdown of this support level will send the pair towards local lows at 1.2685 and 1.2400.
More distant targets for the decline of GBP/USD are located at the local support levels of 1.2250, 1.2085, and 1.2000 (the low in the GBP/USD downside wave that started in July 2014 near 1.7200).
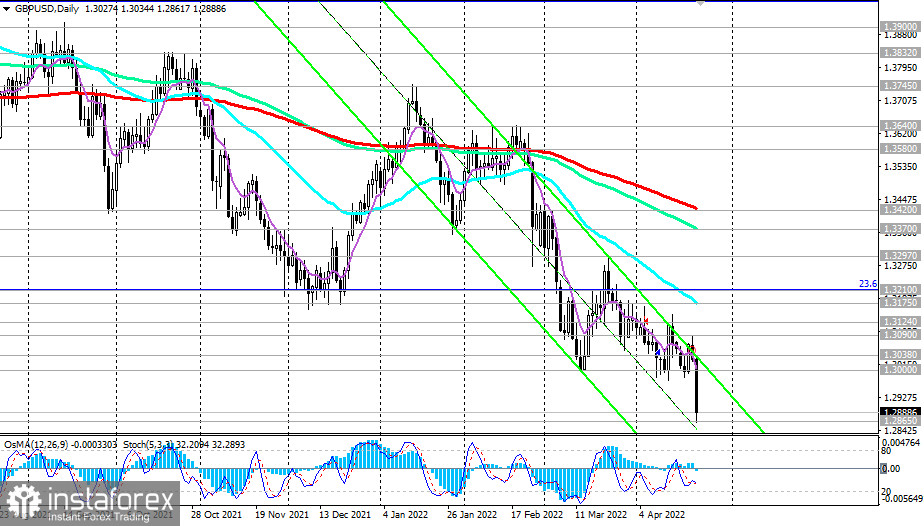
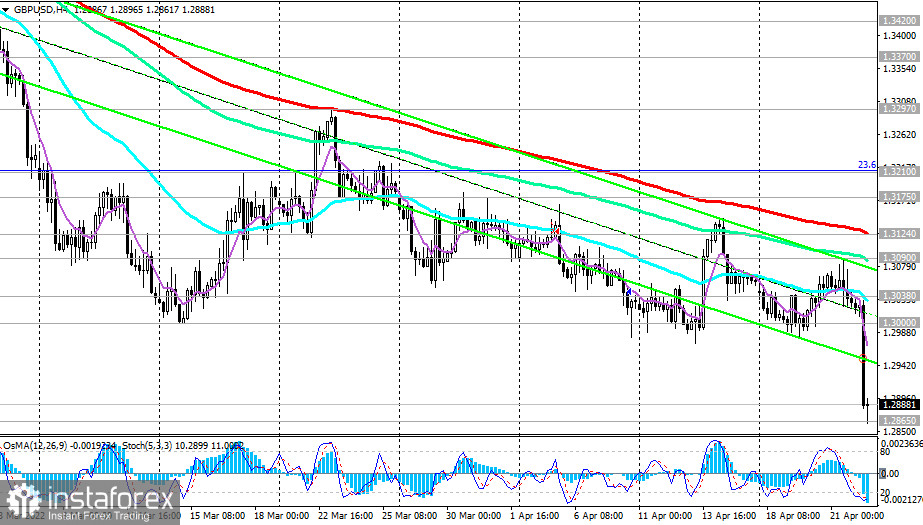
In an alternative scenario, and after a local breakdown of the resistance level of 1.3000, GBP/USD will resume growth. The target of this upward correction may be resistance levels 1.3038 (200 EMA on the 1-hour chart), 1.3090 (144 EMA on the 4-hour chart), 1.3124 (200 EMA on the 4-hour chart), and 1.3175 (50 EMA on the daily chart and local lows).
However, only growth in the zone above the resistance levels of 1.3420 (200 EMA on the daily chart), and 1.33370 (200 EMA on the weekly chart) can reverse the situation, increasing the probability of GBP/USD growth in the long-term bull market zone above the key resistance level of 1.4580 (200 EMA on the monthly chart and the 50% Fibonacci retracement level to the decline of GBP/USD in the wave that began in July 2014 near the level of 1.7200).
Support levels: 1.2865, 1.2800, 1.2700, 1.2685, 1.2400, 1.2250, 1.2085, 1.2000
Resistance levels: 1.3000 1.3038 1.3090 1.3124 1.3175 1.3210 1.3297 1.3370 1.3420 1.3580 1.3640 1.3700 1.3745 1.3832 1.30.40
Trading tips
Sell Stop 1.2860. Stop-Loss 1.2980. Take-Profit 1.2800, 1.2700, 1.2685, 1.2400, 1.2250, 1.2085, 1.2000
Buy Stop 1.2980. Stop-Loss 1.2860. Take-Profit 1.3000, 1.3038, 1.3090, 1.3124, 1.3175, 1.3210, 1.3297, 1.3370, 1.3400