 English
  Русский
 Bahasa Indonesia
 Bahasa Malay
 ไทย
ไทย Español
 Deutsch
 Български
 Français
 Tiếng Việt
 中文
中文 বাংলা
বাংলা हिन्दी
 Čeština
 Українська
 Română

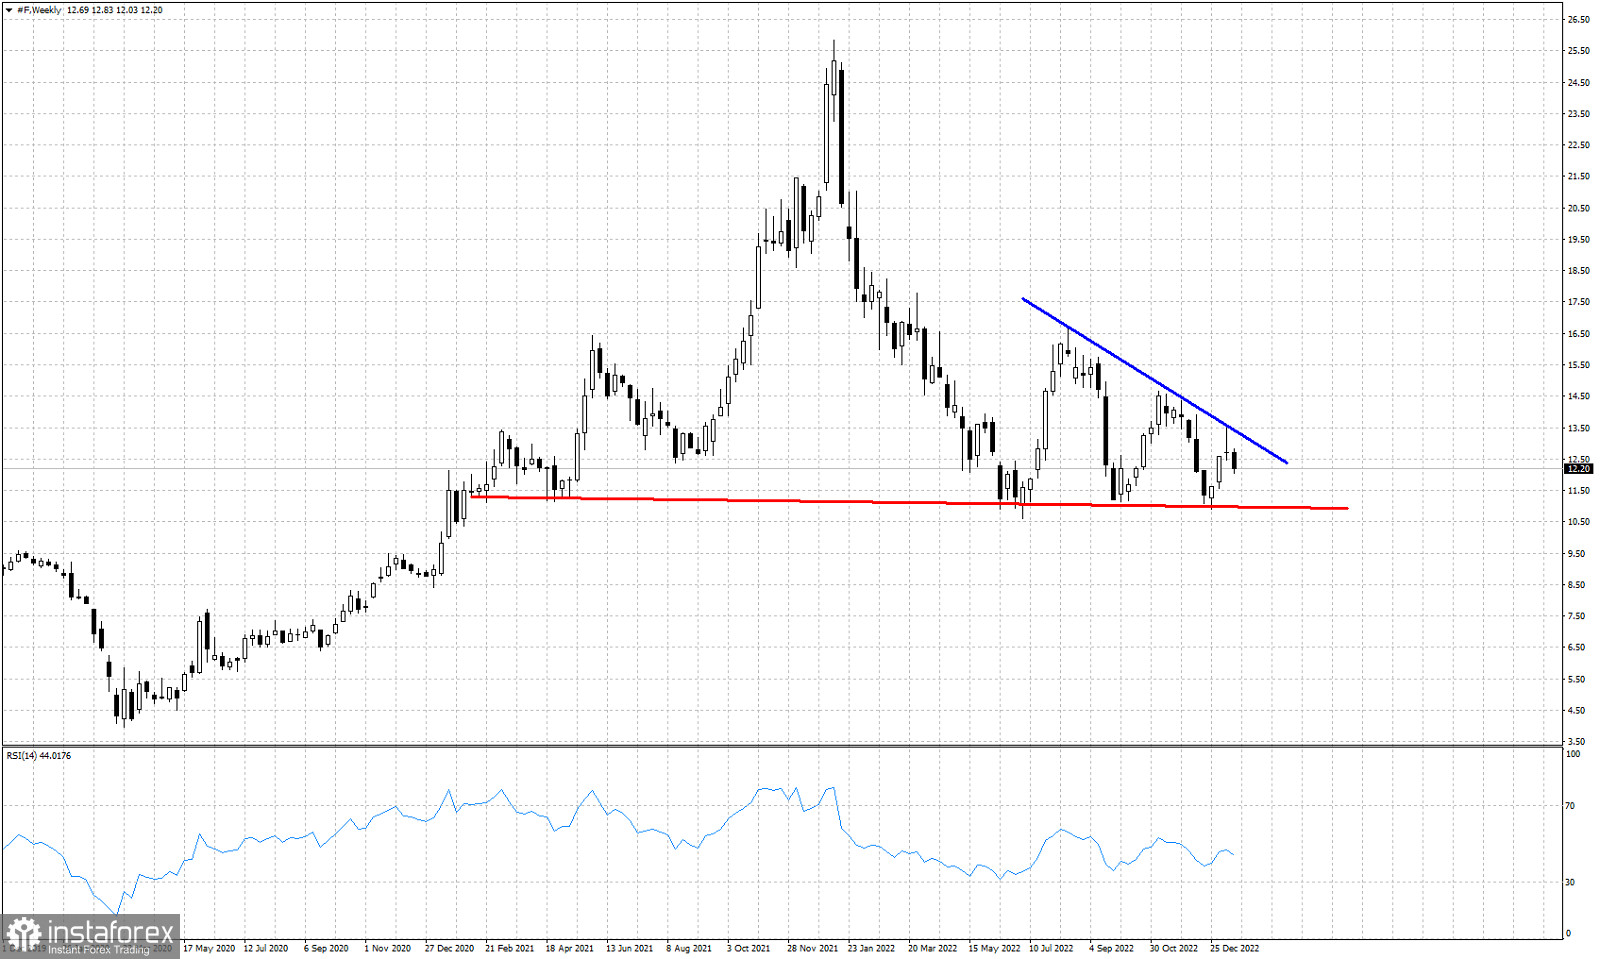
Blue line- resistance
Red line -support
In our previous posts on Ford stock price we have succeeded in forecasting the decline towards $11 after the rejection at the $14.50 resistance area and we also forecasted the bounce towards the trend line at $13.50-13.80. Price once again shows rejection signs. Last week's candle was bearish because of the long upper tail. Price also got rejected at the trend line resistance and this week price is making new lower lows relative to the previous week. Price action suggests that Ford stock price should continue lower towards the major horizontal support of $11. As long as price is below the blue downward sloping resistance trend line, price will be vulnerable to producing a new bearish signal by breaking below $11.