 English
  Русский
 Bahasa Indonesia
 Bahasa Malay
 ไทย
ไทย Español
 Deutsch
 Български
 Français
 Tiếng Việt
 中文
中文 বাংলা
বাংলা हिन्दी
 Čeština
 Українська
 Română

Trend analysis (Figure 1).On Tuesday the market from 1.0506 (yesterday's daily candlestick close), moving upwards, will try to reach again the 14.6% pullback level, 1.0575 (red dotted line). On testing this line, continuation of upward movement with the target to reach the pullback level of 23.6%, 1.0639 (red dotted line) is possible. A pullback is possible from this level downwards.
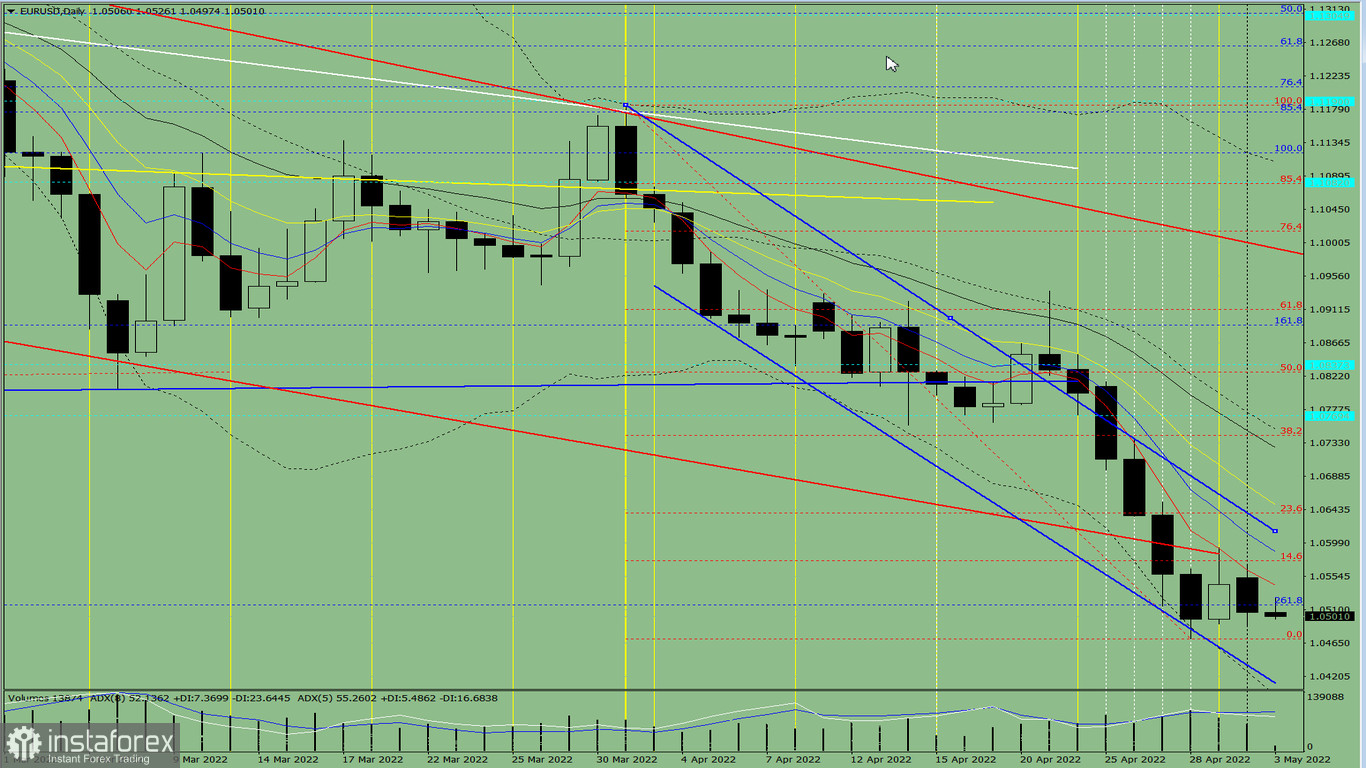
Figure 1 (daily chart).Complex analysis:- indicator analysis - up;- Fibonacci levels - up;- volumes - up;- candlestick analysis - up;- trend analysis - up;- Bollinger bands - up;- weekly chart - up.Conclusion:Today, the price from 1.0506 (yesterday's daily candlestick close) will try to reach the pullback level of 14.6%, 1.0575 (red dotted line). On testing this line, continuation of upward movement with the target to reach the pullback level of 23.6%, 1.0639 (red dotted line) is possible. A pullback is possible from this level downwards.Another scenario: the price from 1.0506 (yesterday's daily candlestick close), moving downwards, will try to reach the support line 1.0416 (blue bold line). If this line is tested, further upward movement with the target to reach the pullback level of 14.6% at 1.0575 (red dotted line) is possible.