 English
  Русский
 Bahasa Indonesia
 Bahasa Malay
 ไทย
ไทย Español
 Deutsch
 Български
 Français
 Tiếng Việt
 中文
中文 বাংলা
বাংলা हिन्दी
 Čeština
 Українська
 Română

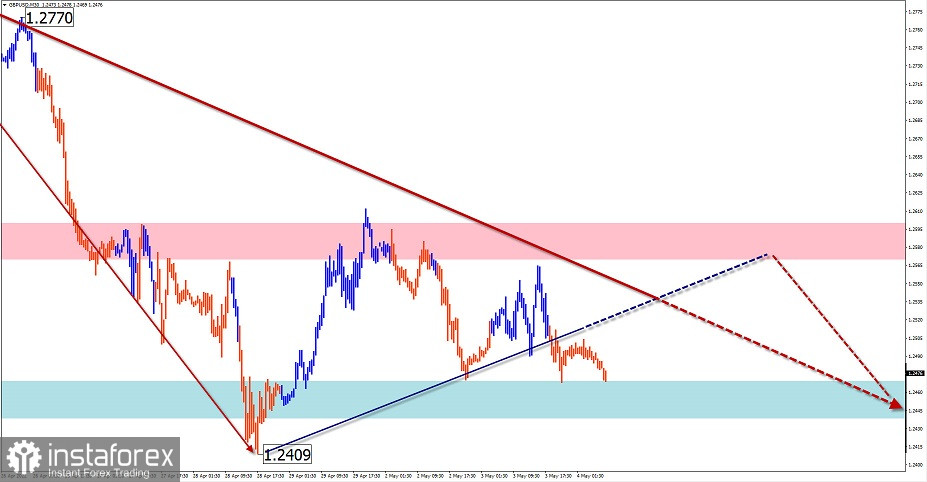
GBP/USD
Analysis:The English Pound Sterling in its main pair continues its downtrend. Having lost more than 15 price points in a year and a half, the pair's price has reached the limits of a strong monthly TF support. Since late April, quotations have been moving sideways, forming an intermediate correction of the last section of the trend.Forecast:Today, a continuation of the pair's general sideways movement vector is expected within the borders of the price corridor marked by the opposite zones. After the pressure on the support zone in the next session, we can expect a change of direction and growth of the rate towards the resistance zone.Potential reversal zonesResistance:- 0.7160/0.7190Support:- 0.7080/0.7050Recommendations:Trading in the Australian dollar market today is risky and could lead to deposit losses. It is recommended to refrain from trading in the pair until the upcoming price rebound is completed, monitoring the selling signals around the resistance zone.
AUD/USD
Analysis:A downward wave has been developing on the Australian dollar chart since April 5. On the higher timeframe, it is closing in on a flat corrective wave pattern. Quotes have reached the upper boundary of a powerful potential reversal zone. Signals of an imminent change of course have not yet been observed. Quotes have been moving sideways since last week.Outlook:Price movement with a general sideways vector is expected over the next 24 hours. After the pressure on the support zone a change of the course and a short-term rise to the resistance area is likely.Potential reversal zonesResistance:- 0.7160/0.7190Support:- 0.7080/0.7050Recommendations:Trading in the Australian dollar market today is risky and could lead to deposit losses. It is recommended to refrain from trading in the pair until the upcoming price rebound is completed, monitoring the selling signals around the resistance zone.

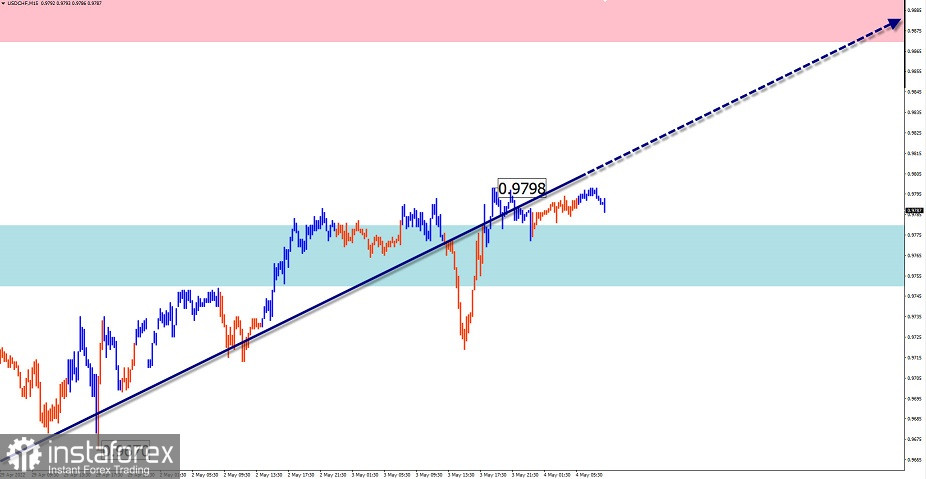
USD/CHF
Analysis:The uptrend of the main Swiss franc pair that started last January has brought the quotations to the lower boundary of a powerful potential reversal zone. The structure of the wave looks completed by now, but there are no signals of a rate change on the chart.Outlook:Today we can expect a continuation of the general upward movement vector. In the first half of the day a short-term flat is possible along the support zone. A resumption of the uptrend and a general increase in volatility is likely at the end of the day.Potential reversal zonesResistance:- 0.9870/0.9900Support:- 0.9780/0.9750Recommendations:There are no selling conditions in the Swiss franc market today. It is recommended to monitor emerging signals for buying the instrument in the support area.
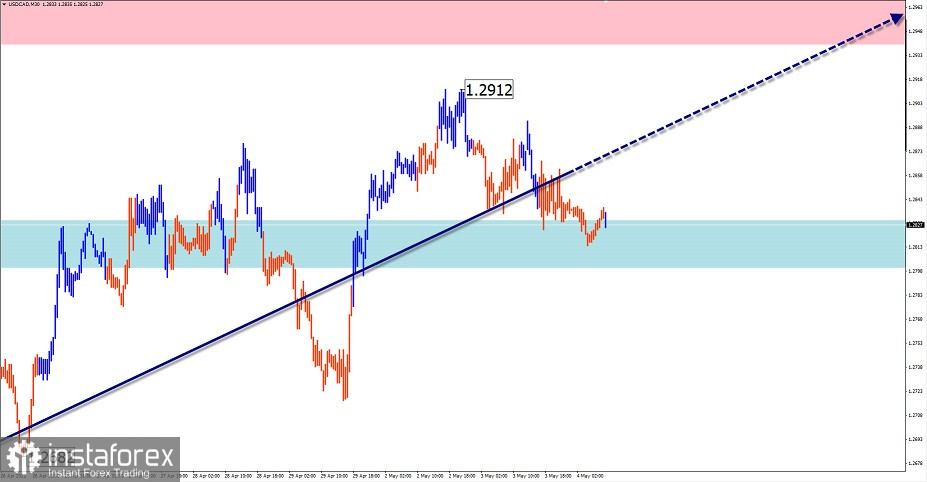
USD/CAD
Analysis:A rising wave has been forming on the chart of the major Canadian dollar pair since last May. The unfinished section started on April 21. The section with a strong impulsive character. The counter correction has an irregular or hidden nature. Quotes have been moving sideways along strong support in recent days.Outlook:After a likely flat in the next session on the pair's chart, we can expect a resumption of the price rise and a rise in the rate, up to the estimated resistance.Potential reversal zonesResistance:- 1.2940/1.2970Support:- 1.2830/1.2800Recommendations:There are no selling conditions in the Canadian dollar market today. It is recommended to monitor all emerging reversal signals for opening long positions in the estimated support area.
Explanation: In simplified wave analysis (SVA), waves consist of 3 parts (A-B-C). The last unfinished wave is analysed. The solid arrow background shows the structure formed. The dotted arrow shows the expected movements.Attention: The wave algorithm does not take into account the duration of the instrument movements over time!