 English
  Русский
 Bahasa Indonesia
 Bahasa Malay
 ไทย
ไทย Español
 Deutsch
 Български
 Français
 Tiếng Việt
 中文
中文 বাংলা
বাংলা हिन्दी
 Čeština
 Українська
 Română

Hello, dear traders!
This week, Bank of Japan Governor Haruhiko Kuroda gave a number of speeches. Although nothing has changed, and the regulator remains dovish. Earlier today, Mr. Kuroda confirmed the central bank's loose monetary policy stance. The main reason behind the dovish BoJ is inflation below the 2% target. In addition, the Japanese economy is still recovering from the fallouts of the Covid-19 pandemic. That is why the regulator has been reluctant to act aggressively, unlike its US counterpart. Given all that, the dollar/yen pair should have scored gains. Yet, this is not the case. So, let's turn to the technical picture on charts.
Weekly
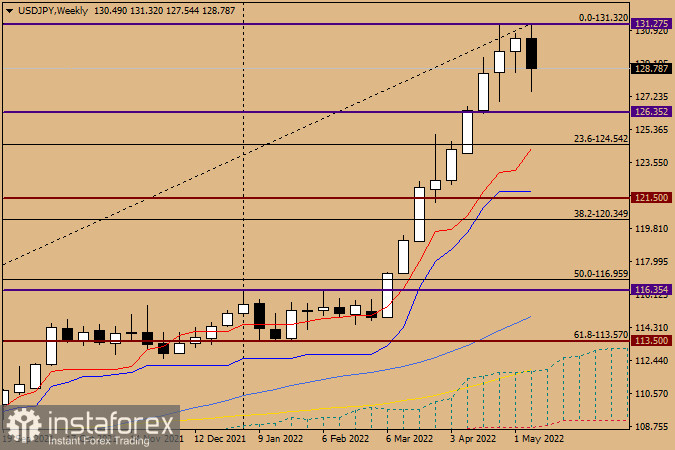
Although it is Friday, let's analyze the weekly chart first. Bulls encountered strong resistance near 131.30. The price has been trying to break the barrier for 3 weeks now. All attempts have been unsuccessful so far. Moreover, the pair was bearish last week. Therefore, the situation is unlikely to change by the end of the day. The trading week may well close with a fall that could cause the formation of a bearish reversal candlestick pattern. Such a possibility has been repeatedly outlined in previous overviews. Moreover, a correction is needed as it has been a strong and long-lasting uptrend. On Monday, the technical picture will be analyzed in detail, taking into account the closing price of the current week. So far, a bearish correction seems more likely. However, it used to happen more than once that a trend in the market continued in spite of the strongest signals.
Daily
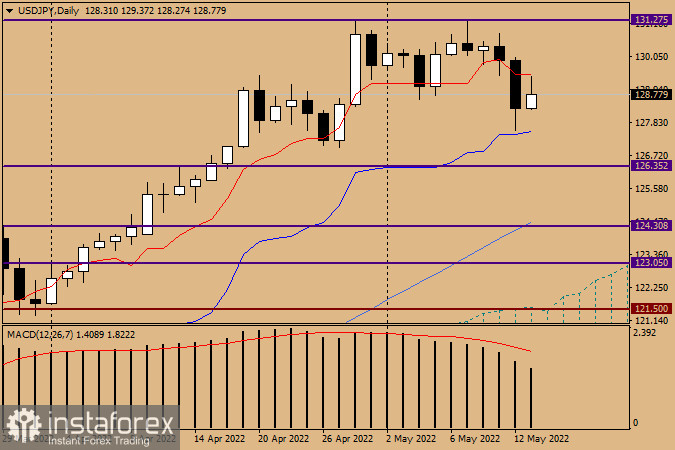
On the daily chart, the red Tenka Line of the Ichimoku indicator has long been providing support for the price. Yesterday, however, it was broken. Today, the price has already bounced off the line. It has even tried to return above it. Technically, the Tenkan Line now serves as an important resistance level. Meanwhile, the blue Kijun Line now stands as support. Yesterday, the price rebounded from this line. The focus should be on these lines on the daily chart. The pair will show growth should the price return above the Tenkan Line. Otherwise, if the quote drops below the Kijun Line and consolidates, the likelihood of a correction will increase. Accurate signals are needed.
Have a nice weekend!