 English
  Русский
 Bahasa Indonesia
 Bahasa Malay
 ไทย
ไทย Español
 Deutsch
 Български
 Français
 Tiếng Việt
 中文
中文 বাংলা
বাংলা हिन्दी
 Čeština
 Українська
 Română

Let's analyze another currency pair today, AUD/USD. This pair is rather interesting to trade which is why so many traders choose this instrument. In fact, any currency pair is unique because it has its own peculiarities or, as some call it, character. This also refers to the AUD/USD pair with its main features being high volatility and accurate technical adherence. This is mainly reflected in the fact that the Aussie is very good at rebounding from levels and lines, as well as at performing pullbacks to already broken obstacles. Also, this currency pair accurately follows the basic and important elements of candlestick analysis. There are other features of the instruments that show up from time to time. Well, let's start our technical review of AUD/USD by analyzing the results of the previous trading week.
Weekly chart
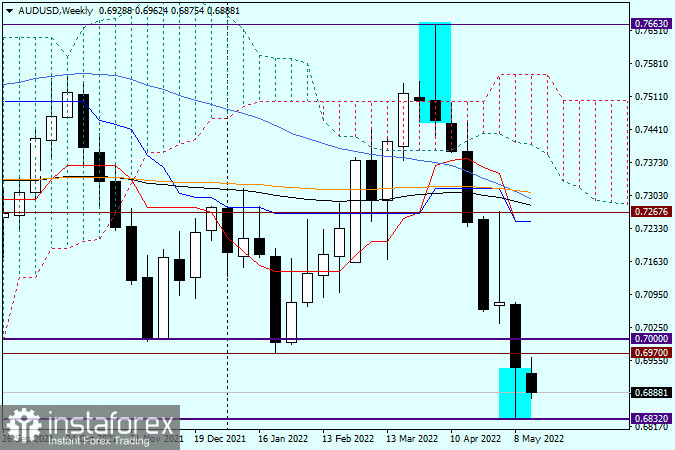
In the week of May 9-13, the Australian dollar resumed its decline against the US dollar, but the situation is not so clear yet. In my personal opinion, the dollar bulls are bothered by a rather long lower shadow of the last weekly candlestick. As we can see, the pair found strong support after reaching the level of 0.6832 and then performed a decent correction, closing the week at 0.6941. The technical picture on the weekly time frame seems quite dubious. On the one hand, the aud/usd bears managed to push the price through the support at 0.6970. On the other hand, the long lower shadow of the last candlestick suggests a further downward scenario. If the sellers continue to stand their ground, and the pair closes the week below the latest low of 0.6832, the descending cycle is likely to continue. At the same time, there is a strong technical level of 0.6800 which can serve as strong support that can provoke a reversal or a good upside rebound. Naturally, the Aussie bulls have their plans. They need to push the quote above the previously broken support level of 0.6970 and close the week above this mark. In this case, the breakout of the 0.6970 level will be considered a false one and will suggest an upward corrective scenario. However, just above 0.6970, there is an important technical, historical and psychological level of 0.7000. At this point, we may observe a fierce fight between the opposing forces. Thus, the key levels for this week will be the support zone of 0.6832-0.6800 and the resistance area of 0.6970-0.7000.
Daily chart
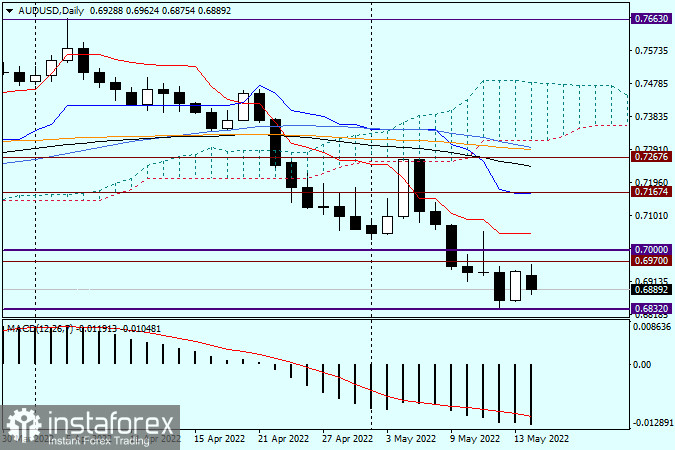
Despite a bullish engulfing candlestick formed on Friday, the pair stays under pressure at the moment of writing. The attempts of the bulls to bring the quote above the broken support of 0.6970 found an obstacle at 0.6962, after which the Aussie faced bearish pressure. However, nothing is clear yet. According to trading recommendations, both buying and selling opportunities are available today. I recommend opening long positions on the pair after a true breakout of the resistance zone of 0.6970-0.7000 on a pullback to this area. Follow the same strategy for selling the pair in case there is a breakout of the support area at 0.6832-0.6800 and a pullback from it.
Good luck!