 English
  Русский
 Bahasa Indonesia
 Bahasa Malay
 ไทย
ไทย Español
 Deutsch
 Български
 Français
 Tiếng Việt
 中文
中文 বাংলা
বাংলা हिन्दी
 Čeština
 Українська
 Română

Today, it's our turn to analyze a very interesting pair of North American dollars. Taking advantage of the recent closure of the last weekly trades, we will begin to consider this trading instrument with a weekly timeframe, especially since there is something to pay attention to.
Weekly
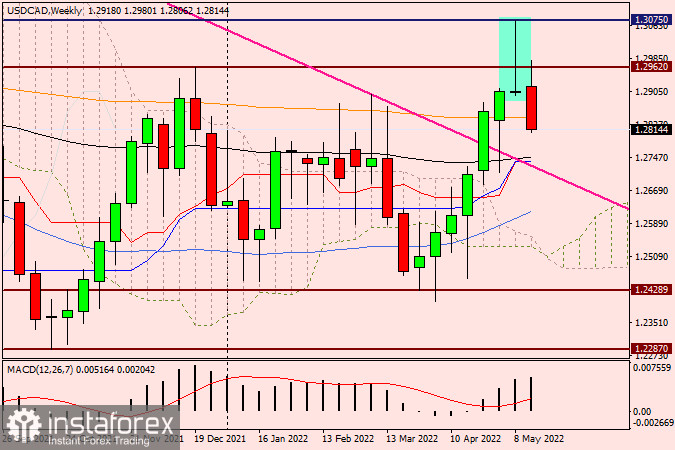
So, following the results of trading on May 9-13, a reversal model of candle analysis, called "Tombstone", appeared on the weekly chart of the USD/CAD currency pair. This model is a very strong reversal signal, especially when it appears at the very end of the upward movement, that is, at its top. In our case, the development of this model is enhanced by unsuccessful attempts to break 1.2962, as well as the round psychological, historical, and technical mark of 1.3000. As you can see, although today is only Tuesday, the market has very actively begun to work out the "Tombstone" reversal model. It is characteristic that before that, USD/CAD bulls once again tried to break through the strong resistance of sellers at 1.2962 and failed again. At the time of writing the review, the pair is already trading below the orange 200-exponential moving average, and in case of continuation of the downward dynamics, it will reach the price zone 1.2750-1.2735. This is where the black 89-EMA, the blue Kijun line, and the pink resistance line 1.4667-1.2899, which was previously passed up, pass. If the market implements this scenario, then everything will be resolved near the pink resistance line. After a rollback to it, the pair may find support and turn back in the north direction. A return under the pink resistance line will herald its false breakdown and a high probability of a subsequent decline, and with renewed vigor. Considering the last reversal candlestick pattern on this chart, I am more inclined to implement a bearish scenario.
Daily
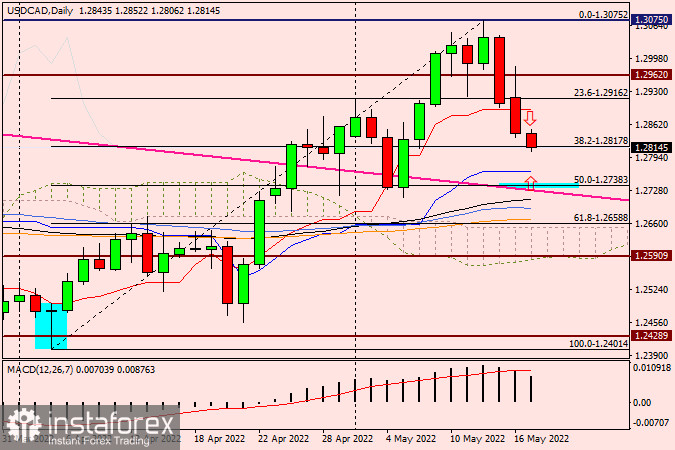
On the daily chart, as we can see, the USD/CAD decline is already in full swing. If this trend continues, then the price will inevitably meet with the blue Kijun line of the Ichimoku indicator, which runs at 1.2766. Well, at the moment, the pair is trying to go down to the first pullback level of 23.6 Fibo on a grid stretched to the growth of 1.2401-1.3075. By the way, the second Fibo level 38.2 passes near the pink resistance line. According to the trading recommendations, both positioning options are still preserved. We consider purchases if bullish reversal candlestick signals begin to appear near the Tenkan daily line and the 1.2766 level at this or smaller time intervals. If the pair turns up from the current values, it will meet the Tenkan red line, which runs right under the strong technical level of 1.2900. The appearance of bearish candles here on the daily, four-hour, and (or) hourly charts will give a signal to open sales. And yet, in my personal opinion, sales, after the appearance of the "Tombstone" model, are most relevant.