 English
  Русский
 Bahasa Indonesia
 Bahasa Malay
 ไทย
ไทย Español
 Deutsch
 Български
 Français
 Tiếng Việt
 中文
中文 বাংলা
বাংলা हिन्दी
 Čeština
 Українська
 Română

Trend analysis
This week, the price is likely to move up from 1.2529 – the closing level of the weekly candlestick – to the 23.6% retracement level of 1.2648 (yellow dotted line). After the quote has reached this level, the target will stand at the 38.2% retracement level of 1.2763 (red dotted line). Should the pair touch this mark, a pullback will occur.
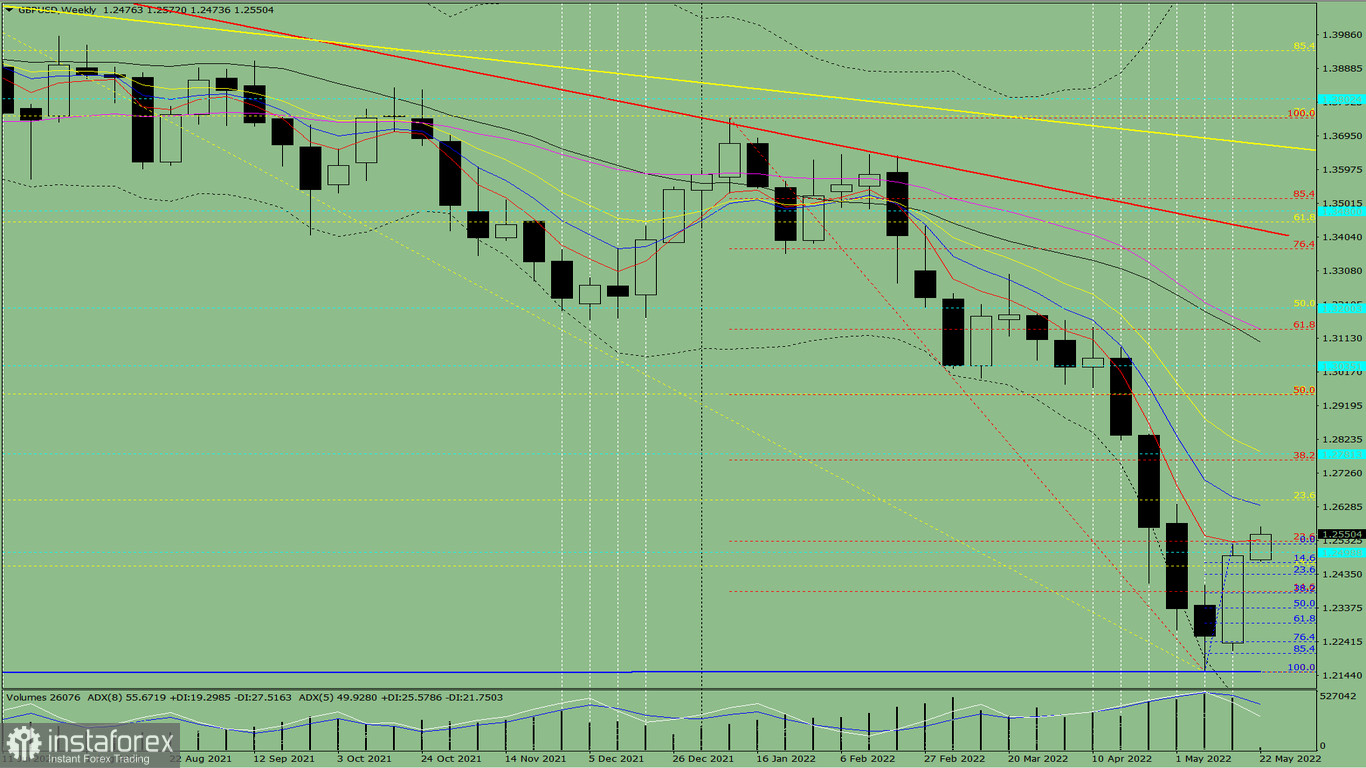
Fig. 1 (weekly chart)
Comprehensive analysis:
- indicator analysis - up
- Fibonacci levels - up
- volumes - up
- candlestick analysis - up
- trend analysis - up
- Bollinger bands – up
- monthly chart - up
Based on comprehensive analysis, an uptrend is likely.
Analysis of the candlestick on the weekly chart: there is a high possibility of an upward move this week, with the white weekly candlestick without lower and upper shadows.
The price is likely to move up from 1.2529 – the closing level of the weekly candlestick – to the 23.6% retracement level of 1.2648 (yellow dotted line). After the quote has reached this level, the target will stand at the 38.2% retracement level of 1.2763 (red dotted line). Should the pair touch this mark, a pullback will occur.
Alternatively, the quote could rise from 1.2529 – the closing level of the weekly candlestick – to the 23.6% retracement level of 1.2648 (yellow dotted line). As soon as the mark is reached, there could be a fall to the 38.2% retracement level of 1.2382 (blue dotted line). Should the price touch this barrier, the upward move will resume to the 23.6% retracement level of 1.2529 (red dotted line).