 English
  Русский
 Bahasa Indonesia
 Bahasa Malay
 ไทย
ไทย Español
 Deutsch
 Български
 Français
 Tiếng Việt
 中文
中文 বাংলা
বাংলা हिन्दी
 Čeština
 Українська
 Română

Another currency pair that we will analyze today will be AUD/USD. A week earlier, it was noted that changes were overdue in the technical picture for this trading instrument and the course of trading in the last five days confirmed this opinion. Before proceeding to technical analysis, it is worth noting that the Reserve Bank of Australia has noticeably tightened its rhetoric and is ready to raise the main interest rate to curb inflation. This factor could not but affect the dynamics of the Australian dollar, which rose against its namesake from the United States at the auction on May 16-20.
Weekly
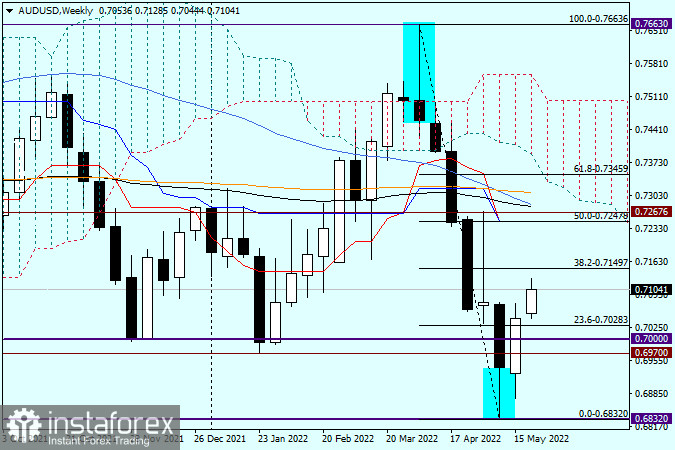
It is already obvious that the long lower shadow of the previous candle was not highlighted in vain. It was after its appearance that the AUD/USD pair turned in a northerly direction and ended trading with an increase, closing the session at 0.7044. This is above the previously broken support level of 0.6970 and the key psychological historical and technical mark of 0.7000. Thus, as it was emphasized earlier, in this scenario, the support of 0.6970 is falsely broken, and a confident closing of weekly trading above the round level of 0.7000 significantly increases the chances of further implementation of the upward scenario. As you can see, the bulls on "Aussie" have started a new trading week quite actively. The pair is growing and at the moment of writing, it is already trading near another fairly strong technical level of 0.7100.
If we stretch the grid of the Fibonacci instrument to a decrease of 0.7663-0.6832, we see that the quote has already overcome the first pullback level of 23.6 Fibo and aims to test the next 38.2, which passes at 0.7150. I would like to note that the levels of 0.7000, 0.7100, and 0.7200 have repeatedly influenced the price dynamics of the "Aussie" and created obstacles for further growth or decline. At this stage, the current growth of the pair should still be perceived as a correction, but if the exchange rate manages to rise to the 0.7250 area, where the 50.0 Fibo level passes from the indicated decline, and the red Tenkan line and the blue Kijun line of the Ichimoku indicator hang directly on it, this will be a good technical point to consider opening short positions. Slightly higher sales are justified from 0.7300, where the orange 200 exponential average passes.
Daily
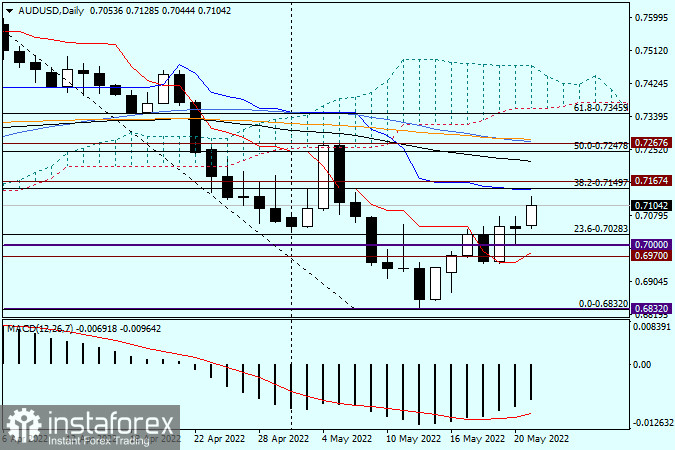
Bullish sentiment is visible on the daily chart. First, the pair has already passed the red Tenkan line up. Second, it absorbs the growth of the Friday Doji candle, which could be perceived as a reversal signal. At this stage of trading, growth may continue, but I consider it a belated decision to open purchase deals. I suggest considering sales when the AUD/USD levels reach 0.7150, 0.7200, 0.7250, and 0.7300. Confirmation will be the candlestick signals at this or smaller time intervals.