 English
  Русский
 Bahasa Indonesia
 Bahasa Malay
 ไทย
ไทย Español
 Deutsch
 Български
 Français
 Tiếng Việt
 中文
中文 বাংলা
বাংলা हिन्दी
 Čeština
 Українська
 Română

It's time to consider the technical picture for the pair of North American dollars. Based on the title of the article, as you understand, the main focus will be on technical analysis. However, before considering the price charts, let me remind you that tomorrow at 19:00 London time, the minutes of the last FOMC meeting will be published, which may reflect some interesting nuances. Apparently, this event will be the main one this week and will have an impact on the price dynamics of all dollar pairs, and USD/CAD will not be an exception here. In the meantime, to the results of the past week's trading.
Weekly
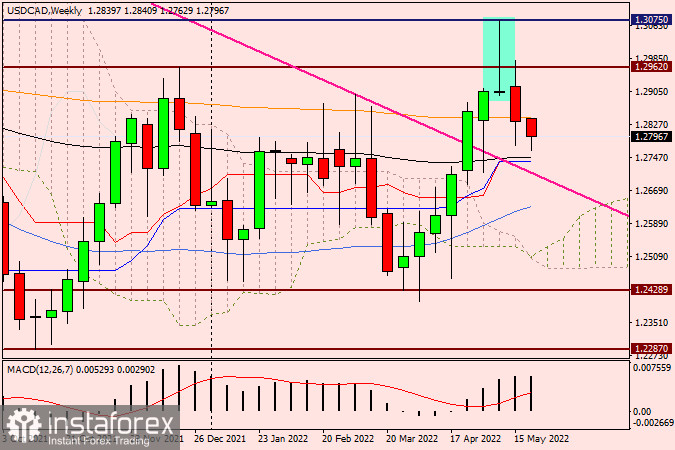
After the highlighted and extremely obvious reversal model of the candle analysis "Tombstone", the pair moved to a downward trend, which is quite natural. Last week closed at 1.2834, which is slightly below the orange 200 exponential moving average. However, the approximately equidistant lower and upper shadows of the last candle indicate that not everything went so smoothly, there was a fierce struggle between the opposing sides. This week, the USD/CAD pair also started with a decline, which at the time of writing stopped at 1.2763, from where a rebound of the quote is observed. Taking into account the "Tombstone" candle model, there are more chances for the continuation of the downward dynamics. In this case, the pair risks falling to the 1.2750-1.2700 area, where it can find strong enough support, if not for a hollow reversal, then for a good corrective pullback. As you can see, the black 89 exponential moving average, the blue Kijun line of the Ichimoku indicator, as well as the broken pink resistance line built on points 1.4667-1.2899 pass in the selected area. In my personal opinion, purely technical purchases are very appropriate here. However, everything will depend on the mood of investors against the US dollar, and they have cooled down a bit in recent days. I fully assume that tomorrow's protocols will bring a new surge in purchases of the US dollar. However, everything can be exactly the opposite. In general, the weekly timeframe looks quite bearish, which means that selling the pair is a priority.
Daily
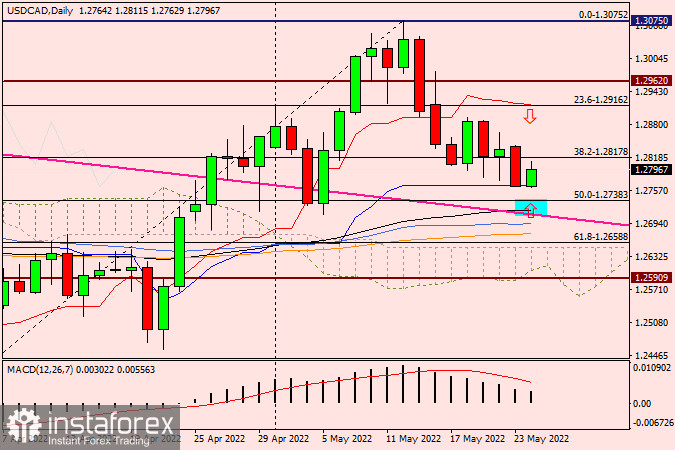
The daily chart clearly shows that the USD/CAD pair has been showing mixed price dynamics recently. This is especially noticeable by the alternation of bullish and bearish candlesticks. The blue Kijun line of the Ichimoku indicator currently provides quite significant support to the price. Although the bulls for this instrument managed to close yesterday's trading slightly below this line, today the pair is trying to push off from it and show an upward trend. Based on the technical picture on the daily chart, I dare to assume both positioning options. Sales, according to the author's personal opinion, are a little more relevant, and at the most favorable prices, it is better to plan them after the rise to the area of 1.2900-1.2920, where the Tenkan red line is also located. In the case of a Kijun breakout, we consider purchases on a rollback to the pink resistance line, where the black 89 EMA is also slightly higher.