 English
  Русский
 Bahasa Indonesia
 Bahasa Malay
 ไทย
ไทย Español
 Deutsch
 Български
 Français
 Tiếng Việt
 中文
中文 বাংলা
বাংলা हिन्दी
 Čeština
 Українська
 Română

Analyzing trades on Thursday:
EUR/USD on 30M chart:
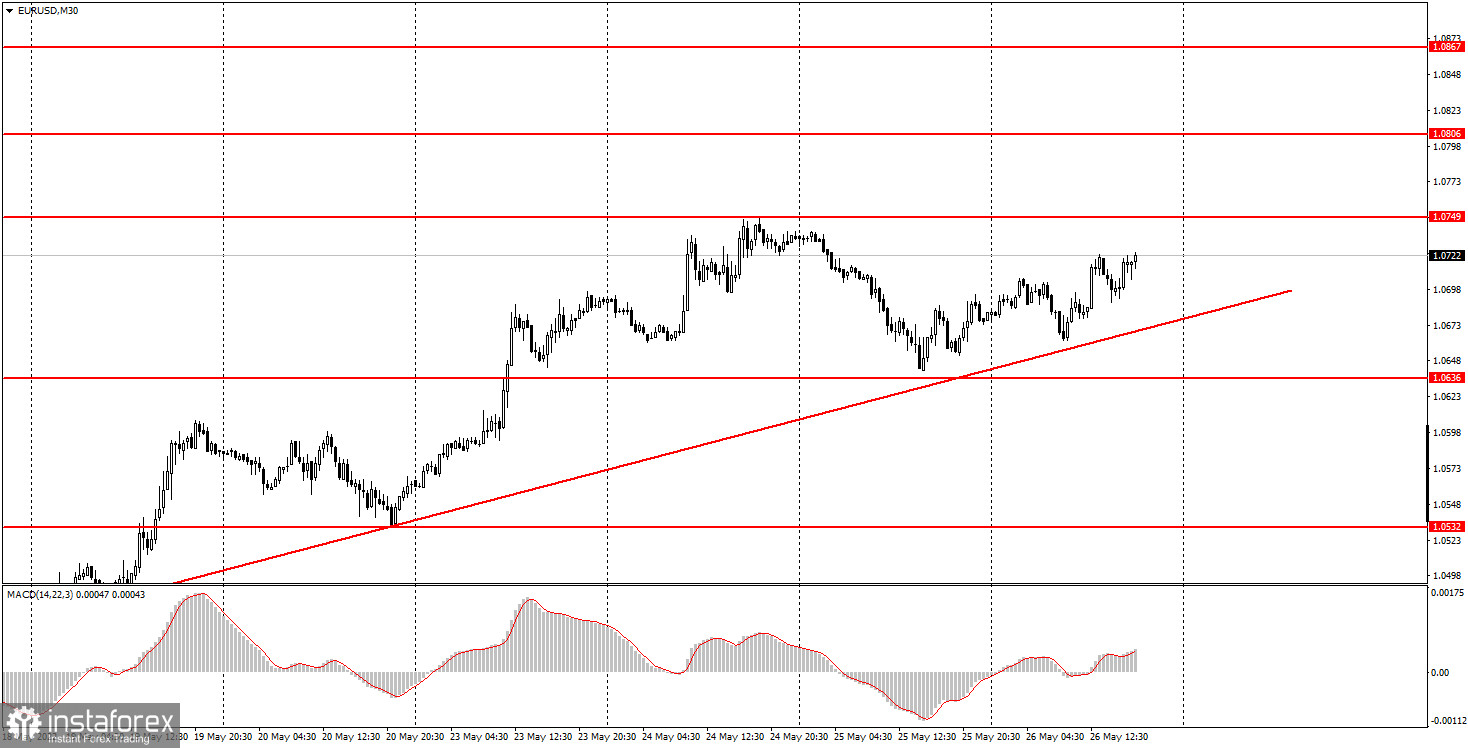
On Thursday, EUR/USD made an attempt to continue its upward movement but did not succeed. Daily volatility was only 70 pips which is rather low in the current conditions. Formally, the European currency was rising but at a very slow pace. The pair maintained its upward movement as the ascending trendline remained relevant. Now the pair needs to return to the level of 1.0749 and try to overcome it. So far, the euro is mainly supported by the technical factor. However, on Thursday, it also gained support from the macroeconomic factor. The second GDP estimate for the first quarter in the US turned out to be even worse than the first one. The first reading was at -1.4% q/q, while the second estimate showed -1.5% q/q. This indicates the negative dynamics of the US economy, which triggered the reaction of traders. Although the reaction was not very strong, it was caused by a report of less importance than the Fed meeting, for example. Apart from that, there was no other important news during the day. On the one hand, the appreciation of the euro may not look valid but from the fundamental point of view, the currency continues to take advantage of the situation.
EUR/USD on 5M chart:
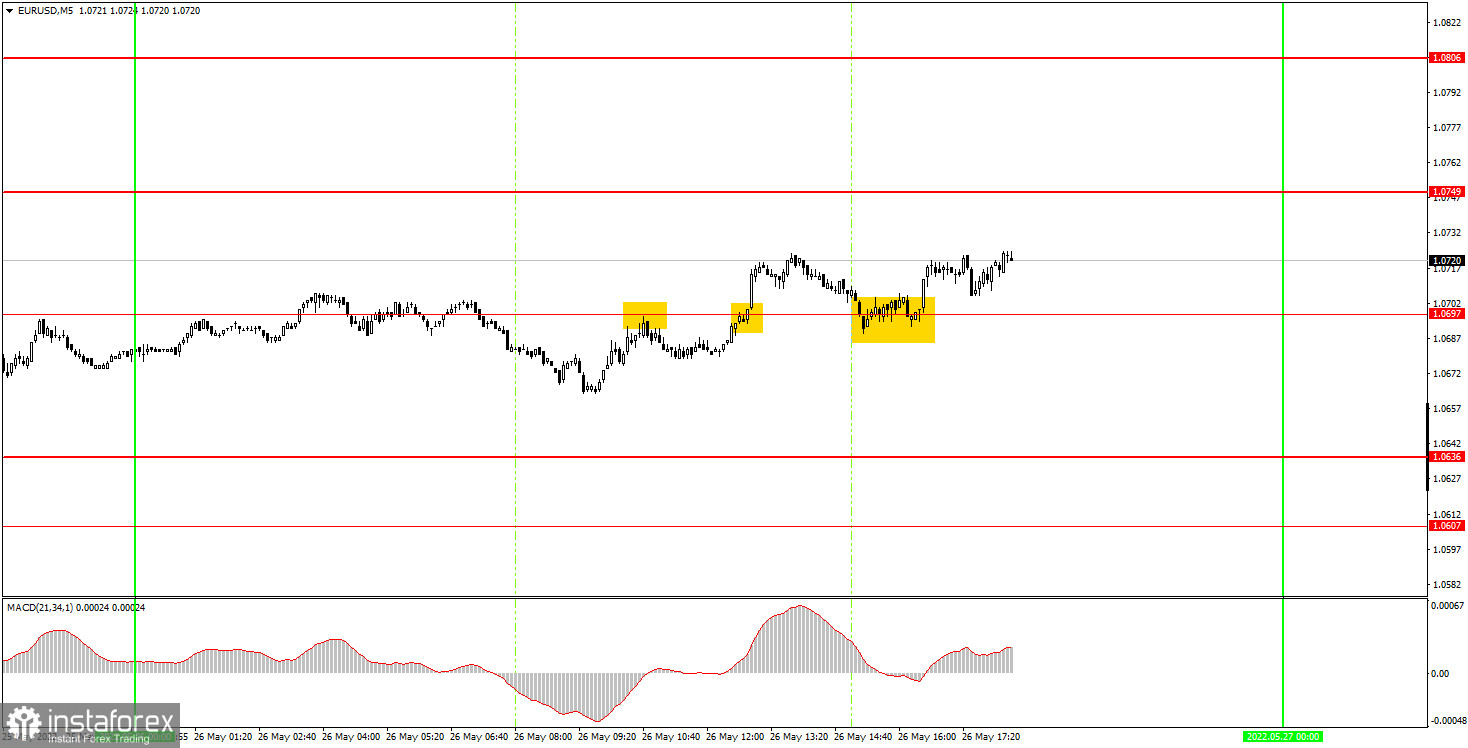
On the 5-minute time frame, the technical picture looks quite unfavorable. The intraday movement was not a flat movement but yet, it was far from a proper trend. The pair often changed direction and pulled back. Therefore, all three trading signals were mixed and were formed around the same level of 1.0697. The first sell signal was false, and the price failed to go down by even 15 pips. Therefore, this trade brought a small loss. The second buy trade was slightly better in the way that it was not a losing trade. The pair went up a few dozen pips but then returned to the level of 1.0697. It resumed growth after the weak data on US GDP had been released. Thus, it was possible to earn 10 pips from this trade. Unfortunately, beginners had to close this day with a minimal loss.
Trading tips on Friday:
On the 30-minute time frame, the ascending trendline is still in place. This means that the euro has a chance to develop growth although it will be of a purely technical nature. So far, this is the best option for the euro. If the fundamental and macroeconomic backgrounds worsen, the euro will plunge quickly. So, the European currency takes full advantage of the situation. On the 5-minute chart on Friday, it is recommended to trade at the levels of 1.0607, 1.0636, 1.0697, 1.0749, and 1.0806. Set a Stop Loss to breakeven as soon as the price passes 15 pips in the right direction. No major events are planned for Friday in the EU. Meanwhile, the US will publish the data on personal income and spending. Markets will most likely downplay this minor report. Yesterday, even the data on GDP did not cause any strong reaction among traders. The euro may continue to develop steady growth.
Basic rules of the trading system
1) The strength of the signal is determined by the time it took the signal to form (a rebound or a breakout of the level). The quicker it is formed, the stronger the signal is.2) If two or more positions were opened near a certain level based on a false signal (which did not trigger a Take Profit or test the nearest target level), then all subsequent signals at this level should be ignored.3) When trading flat, a pair can form multiple false signals or not form them at all. In any case, it is better to stop trading at the first sign of a flat movement.4) Trades should be opened in the period between the start of the European session and the middle of the US trading hours when all positions must be closed manually.5) You can trade using signals from the MACD indicator on the 30-minute time frame only amid strong volatility and a clear trend that should be confirmed by a trendline or a trend channel.6) If two levels are located too close to each other (from 5 to 15 pips), they should be considered support and resistance levels.
On the chart
Support and Resistance Levels are the levels that serve as targets when buying or selling the pair. You can place Take Profit near these levels.
Red lines are channels or trend lines that display the current trend and show in which direction it is better to trade now.
The MACD indicator (14, 22, and 3) consists of a histogram and a signal line. When they cross, this is a signal to enter the market. It is recommended to use this indicator in combination with trend patterns (channels and trendlines).
Important announcements and economic reports that can be found on the economic calendar can seriously influence the trajectory of a currency pair. Therefore, at the time of their release, we recommend trading as carefully as possible or exiting the market in order to avoid sharp price fluctuations.
Beginners on Forex should remember that not every single trade has to be profitable. The development of a clear strategy and money management is the key to success in trading over a long period of time.