 English
  Русский
 Bahasa Indonesia
 Bahasa Malay
 ไทย
ไทย Español
 Deutsch
 Български
 Français
 Tiếng Việt
 中文
中文 বাংলা
বাংলা हिन्दी
 Čeština
 Українська
 Română

Analysis of Thursday's trades:
30M chart of GBP/USD
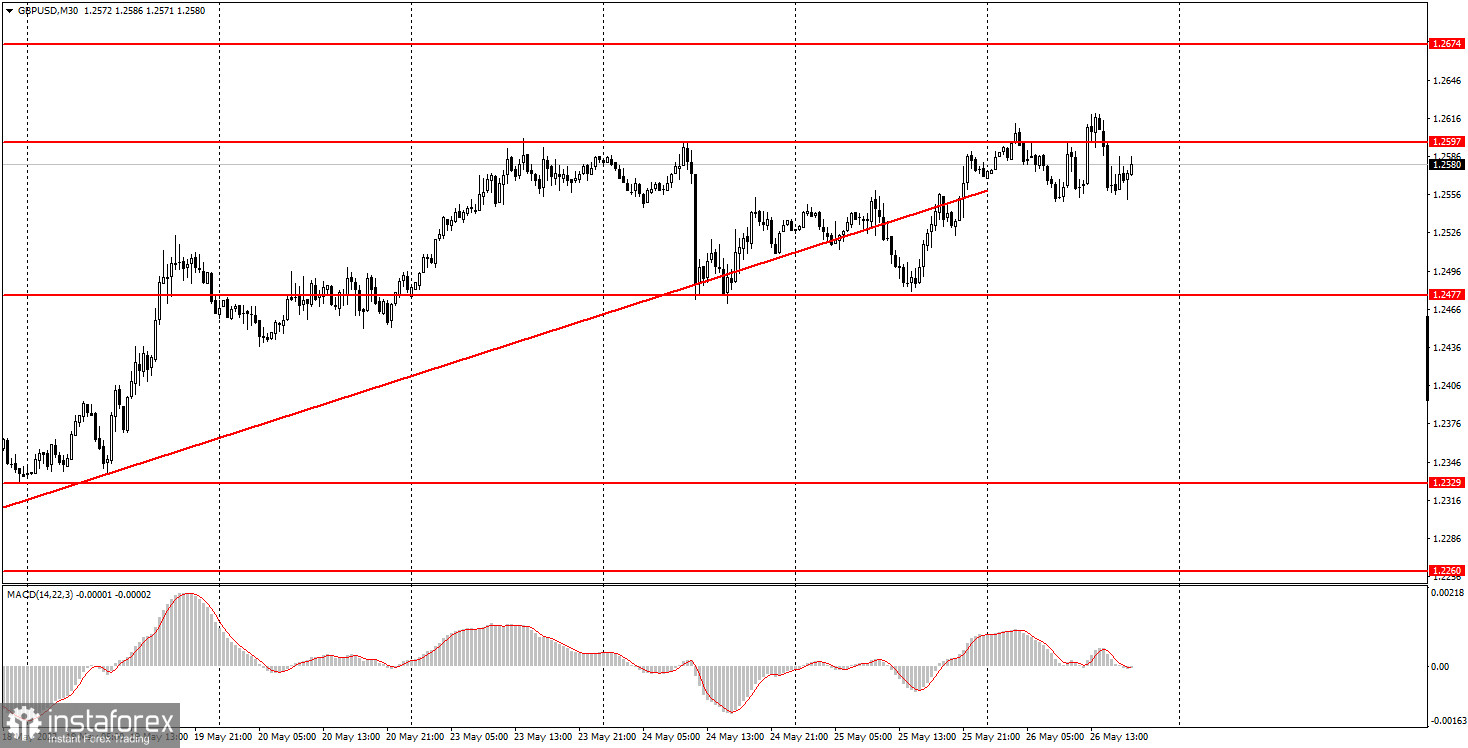
On Thursday, GBP/USD traded around 1.2597. Earlier, the quote had already tested this level but failed to break it. Despite several attempts, the same thing happened on Thursday. Anyway, the uptrend continues although the ascending trendline is broken. In general, the pound hovers around 1.2597. There is still a high likelihood of a breakout. Consequently, the uptrend goes on. However, without the trendline, it will be more difficult to understand the price behavior. In the past 4 days, the pair moved in a narrow-enough range. As for Thursday's macroeconomic calendar, it was empty in the UK and contained the Q1 GDP report in the United States. In fact, the actual figures missed economists' forecasts. Yet, the pound showed no reaction to the results. Meanwhile, the greenback edged down slightly. The pair was flat all day long, with volatility totaling about 70 pips. For the pound, such performance is below average. Generally speaking, the sterling has good growth potential. However, this time, the currency is likely to be more volatile.
5M chart of GBP/USD
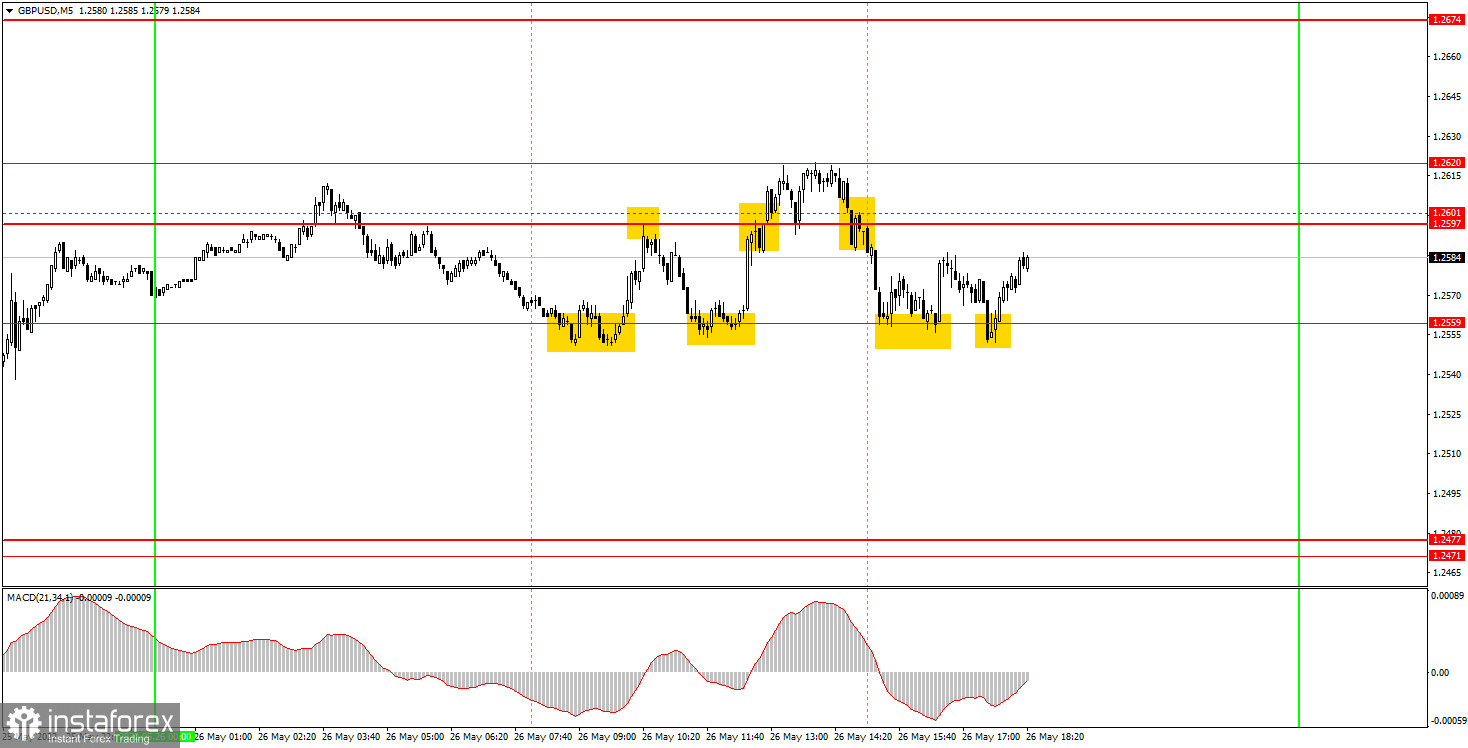
In the M5 time frame, the sideways movement is clearly visible. The pair hovered between 1.2620 and 1.2559 all day long, making signals near the limits of the channel. Notably, the 1.2620 level is the new high that forms the range with the 1.2597 mark. Let's now analyze the signals of the trading day. The first signal was to buy the pair. It was produced during the European session at around 1.2559. The price then went up to 1.2597, tested it, and pulled back. The signal brought about 20 pips of profit. As soon as the pair pulled back, it was time to go short. In this case, profit again totaled 20 pips. The quote tested the 1.2559 mark and generated another buy signal. So, long positions could have been opened. When the price broke through 1.2597, the upward move stopped, and the pair fell below the mark. The third signal brought some 20 pips of profit. After consolidation below 1.2597, the long position should have been closed and a short one opened. It generated another 20 pips of profit. The pair then descended to 1.2559, creating two more buy signals. Another 20 pips of profit were yielded. The quote then failed to consolidate below 1.2559. Generally speaking, many signals were made on Thursday but each of them was profitable. The total profit was about 60 pips.
Trading plan for Friday:
In the 30M time frame, the uptrend seems to have ended. The pair has failed to consolidate below 1.2477, so the pound has good growth potential. The quote now needs to break through 1.2597 to go further up. Targets in the M5 time frame are seen at 1.2371, 1.2471-1.2477, 1.2559, 1.2597-1.2620, and 1.2674-1.2697. A stop-loss order should be set at the breakeven point as soon as the price passes 20 pips in the right direction after a trade has been opened. Friday's macroeconomic calendar in the UK contains no important releases. In the US, data on personal income and personal spending will be published. However, these reports are of secondary importance. There is a 90% probability that if the results do not disappoint, no reaction from the market will follow.
Basic principles of the trading system:
1) The strength of the signal depends on the time period during which the signal was formed (a rebound or a break). The shorter this period, the stronger the signal.
2) If two or more trades were opened at some level following false signals, i.e. those signals that did not lead the price to the Take Profit level or the nearest target levels, then any consequent signals near this level should be ignored.
3) During the flat trend, any currency pair may form a lot of false signals or produce no signals at all. In any case, the flat trend is not the best condition for trading.
4) Trades are opened in the time period between the beginning of the European session and until the middle of the American one when all deals should be closed manually.
5) We can pay attention to the MACD signals in the 30M time frame only if there is good volatility and a definite trend confirmed by a trend line or a trend channel.
6) If two key levels are too close to each other (about 5-15 pips), then this is a support or resistance area.
How to interpret charts:
Support and resistance levels can serve as targets when buying or selling. You can place Take Profit near them.
Red lines are channels or trend lines that display the current trend and show which direction is better to trade.
MACD indicator (14,22,3) is a histogram and a signal line showing when it is better to enter the market when they cross. This indicator is better to be used in combination with trend channels or trend lines.
Important speeches and reports that are always reflected in the economic calendars can greatly influence the movement of a currency pair. Therefore, during such events, it is recommended to trade as carefully as possible or exit the market in order to avoid a sharp price reversal against the previous movement.
Beginner traders should remember that every trade cannot be profitable. The development of a reliable strategy and money management is the key to success in long-term trading.