 English
  Русский
 Bahasa Indonesia
 Bahasa Malay
 ไทย
ไทย Español
 Deutsch
 Български
 Français
 Tiếng Việt
 中文
中文 বাংলা
বাংলা हिन्दी
 Čeština
 Українська
 Română

GBP/USD 5M
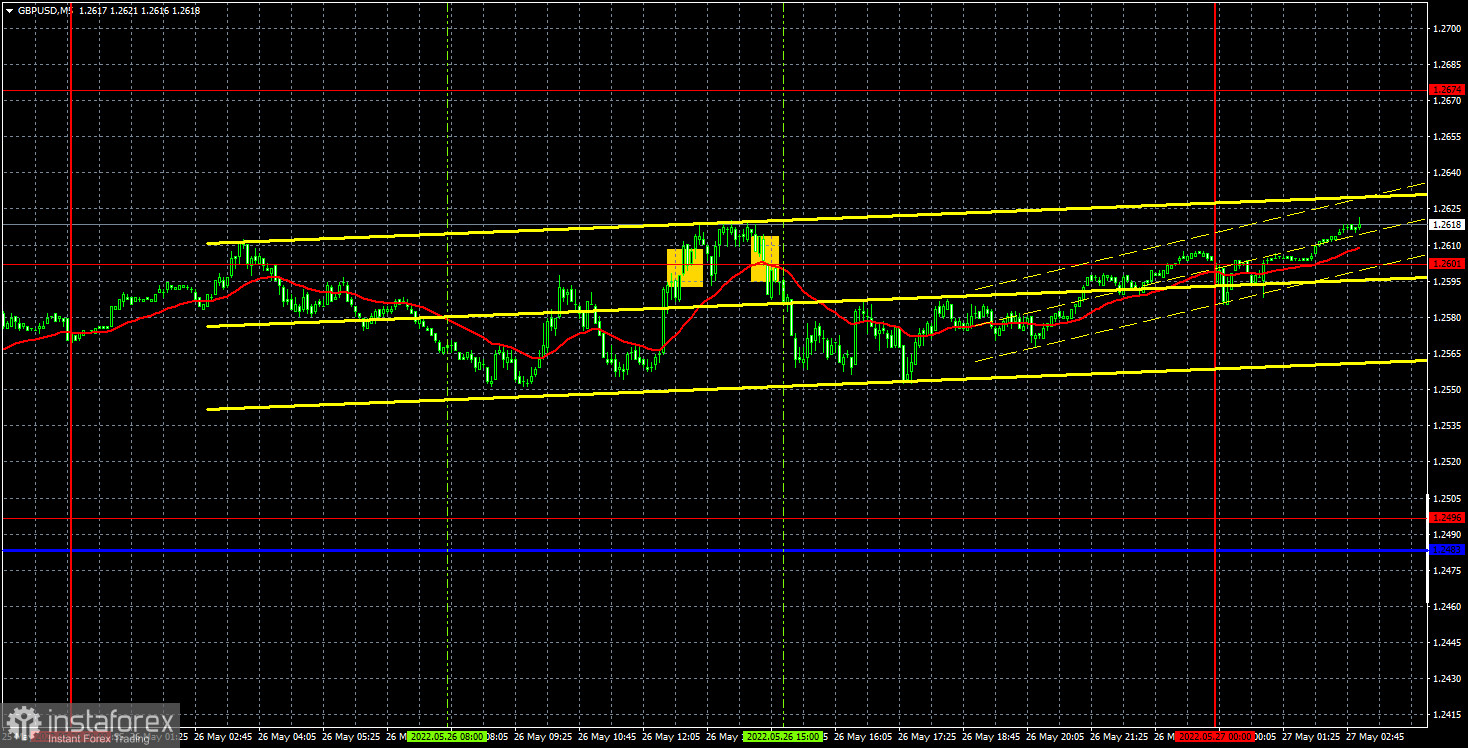
Yesterday, the GBP/USD currency pair tried to continue its upward movement and by the end of the day was again near the level of 1.2601, which it had already worked out this week. Thus, despite overcoming the ascending trend line, which is no longer relevant, the upward trend continues, as we warned. The pair is also above the critical line, so the pound, like the euro, has good chances for technical growth. "Technical", because now both European currencies are supported only by the technical factor. From time to time, of course, various reports are published, but, as this week has shown, they can also put pressure on the British currency. From our point of view, only a consolidation below the critical line can be regarded as an attempt to start a new short-term downward trend. But even in this case, there is no guarantee that the pair will not start flat or swing. The only report of the previous day - US GDP - had a very restrained effect on the pound/dollar pair, and volatility was closer to low than to high.
There were only two trading signals on Thursday. First, the pair settled above the extreme level of 1.2601, but could not go up even 20 points, which would be enough to set Stop Loss to breakeven. Then the pair settled below 1.2601, but also failed to develop a downward movement and went down only 35 points at the high. Thus, most likely, traders received a loss on the first transaction of 20 points, and on the second - a profit of 20 points. As a result, the day ended in zero profit. It could have been better, but yesterday the pair moved mainly sideways, which is clearly seen in the chart above.
COT report:
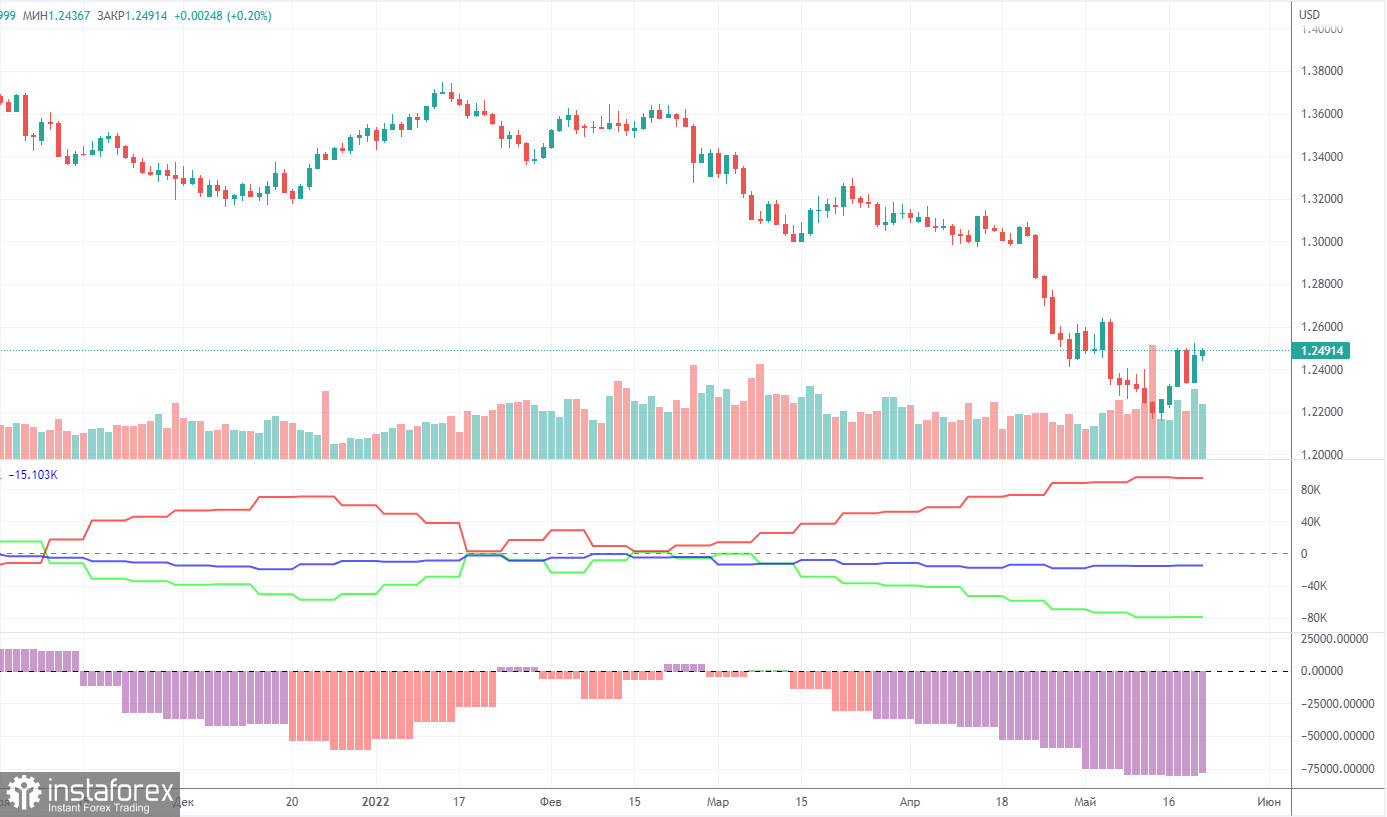
The latest Commitment of Traders (COT) report on the British pound showed almost no change. During the week, the non-commercial group closed 2,800 long positions and 3,200 short positions. Thus, the net position of non-commercial traders increased by only 500. The net position has been falling for three months already, which is perfectly visualized by the green line of the first indicator in the chart above. Or the histogram of the second indicator. The non-commercial group has already opened a total of 106,000 shorts and only 26,000 longs. Thus, the difference between these numbers is already more than four times. This means that the mood among professional traders is now "pronounced bearish" and this is another factor that speaks in favor of the continuation of the fall of the British currency. Note that in the pound's case, the COT report data very accurately reflects what is happening on the market: the mood of traders is "strongly bearish", and the pound has been falling against the US dollar for a very long time. We do not yet see specific signals for the end of the downward trend, however, usually a strong divergence of the red and green lines of the first indicator signals the imminent end of the trend and the beginning of a new one. Therefore, the conclusion is that an upward trend may begin in the near future, but it is dangerous to try to catch its beginning at the lowest point. The pound may well demonstrate another round of decline before it starts to grow.
We recommend that you familiarize yourself with:
Overview of the EUR/USD pair. May 27. The information field is already oversaturated with data from the Fed and the ECB.
Overview of the GBP/USD pair. May 27. All the danger of a trade war between the EU and the UK is already understood even in Ireland, which is "at the forefront" of the conflict.
Forecast and trading signals for EUR/USD on May 27. Detailed analysis of the movement of the pair and trading transactions.
GBP/USD 1H
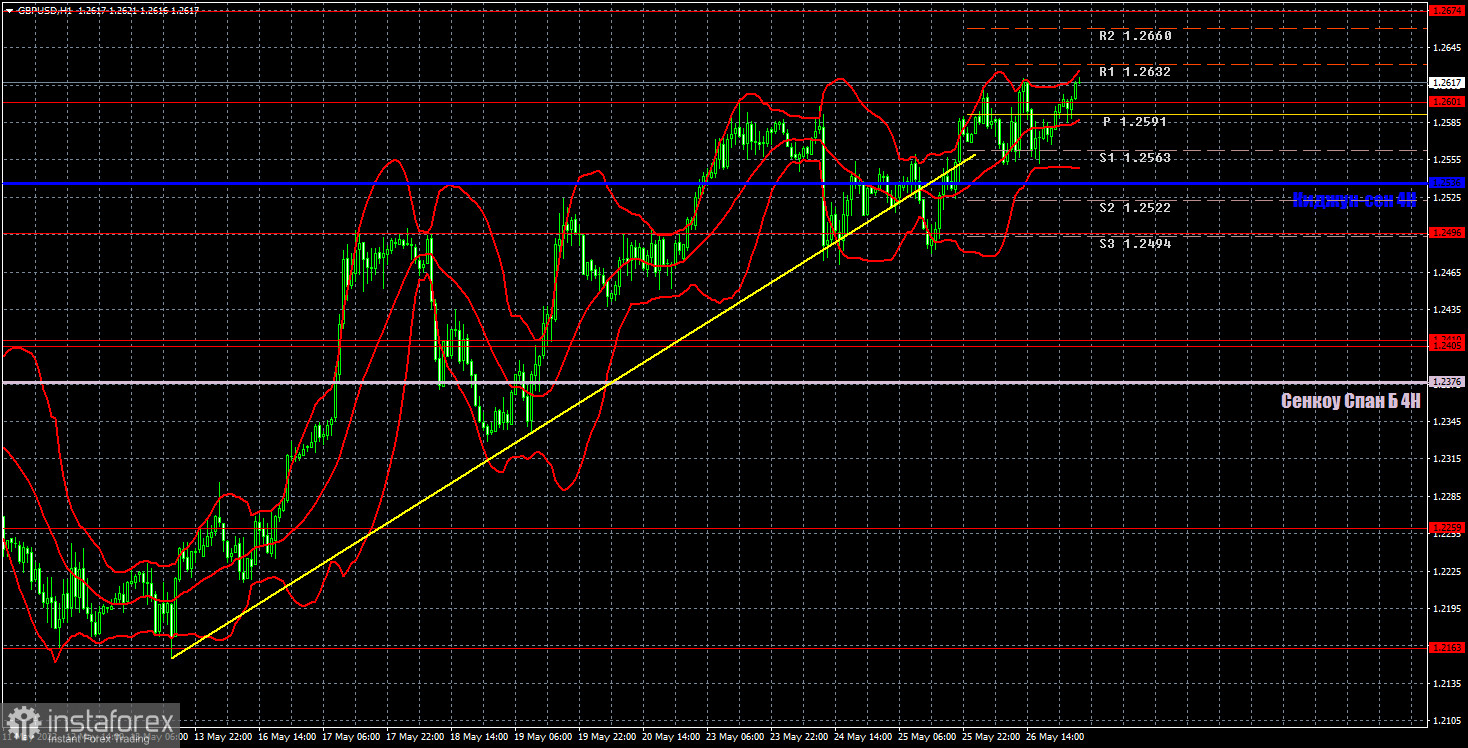
It can be seen on the hourly timeframe that the pair has settled below the trend line, but the upward trend still remains relevant until the price consolidates below the Kijun-sen. The pound, like the euro, continues to grow solely on the technical factor with little support from macroeconomic statistics. You should be ready for a possible flat, as the upward movement has clearly slowed down this week. Today we highlight the following important levels: 1.2259, 1.2405-1.2410, 1.2496, 1.2601, 1.2674. The Senkou Span B (1.2376) and Kijun-sen (1.2536) lines can also be sources of signals. Signals can be "rebounds" and "breakthrough" of these levels and lines. The Stop Loss level is recommended to be set to breakeven when the price passes in the right direction by 20 points. Ichimoku indicator lines can move during the day, which should be taken into account when determining trading signals. The chart also contains support and resistance levels that can be used to take profits on trades. There are no interesting events and reports for the UK on the calendar of events. And the US will publish a report on personal income and spending of the American population. Not the most significant report right now, so we do not expect a strong market reaction to it.
Explanations for the chart:
Support and Resistance Levels are the levels that serve as targets when buying or selling the pair. You can place Take Profit near these levels.
Kijun-sen and Senkou Span B lines are lines of the Ichimoku indicator transferred to the hourly timeframe from the 4-hour one.
Support and resistance areas are areas from which the price has repeatedly rebounded off.
Yellow lines are trend lines, trend channels and any other technical patterns.
Indicator 1 on the COT charts is the size of the net position of each category of traders.
Indicator 2 on the COT charts is the size of the net position for the non-commercial group.