 English
  Русский
 Bahasa Indonesia
 Bahasa Malay
 ไทย
ไทย Español
 Deutsch
 Български
 Français
 Tiếng Việt
 中文
中文 বাংলা
বাংলা हिन्दी
 Čeština
 Українська
 Română

Details of the economic calendar from May 26
Weekly data on jobless claims in the United States showed an increase in their volume. This is a negative factor for the US labor market.
Statistics details:
The volume of continuing claims for benefits increased from 1.315 million to 1.346 million.
The volume of initial claims for benefits decreased slightly from 218,000 to 210,000.
Analysis of trading charts from May 26
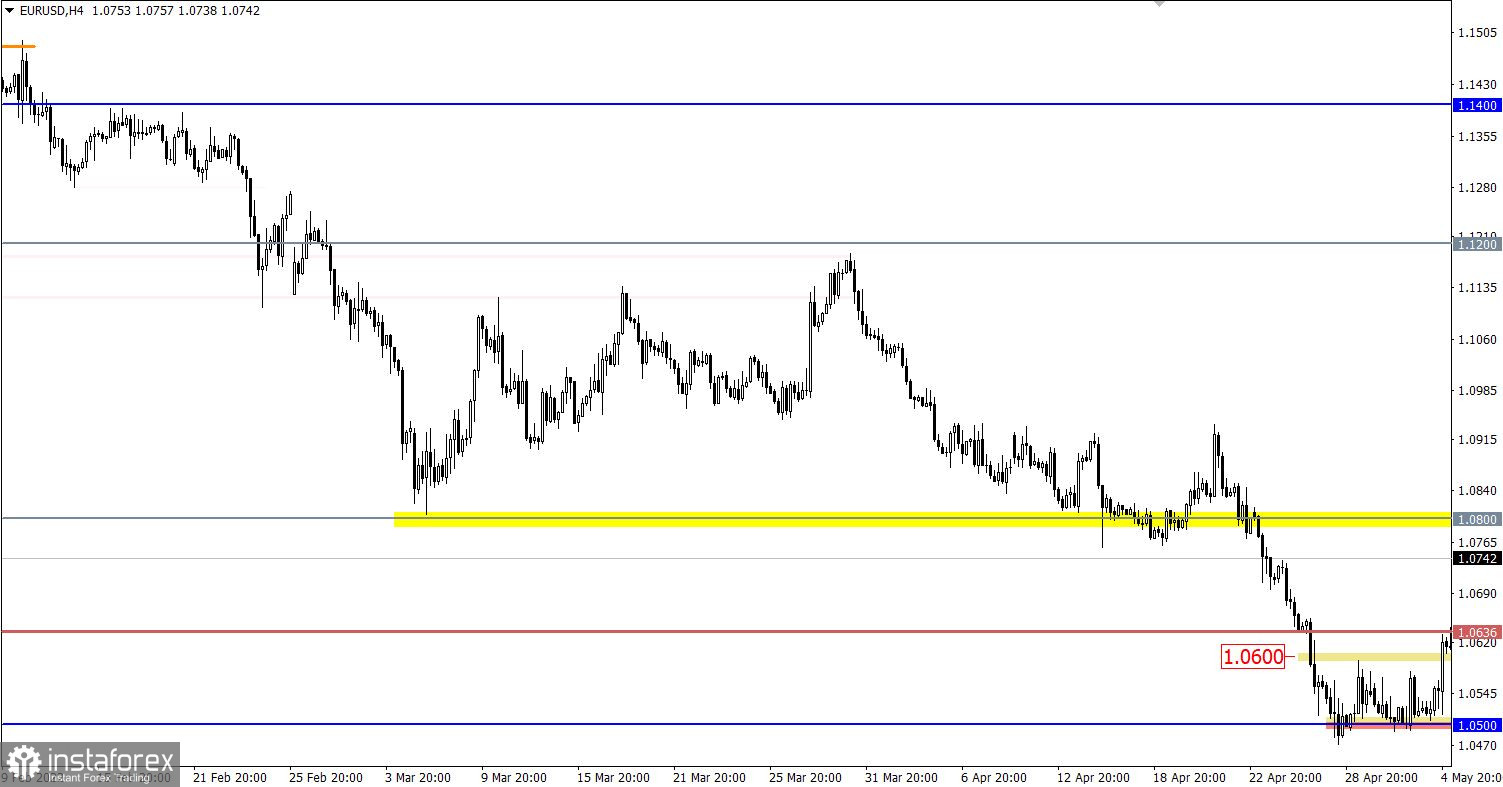
The EURUSD currency pair prolonged the corrective movement during the price rebound from the support level of 1.0636. This led to an increase in the volume of long positions and an update of the local high of the week.
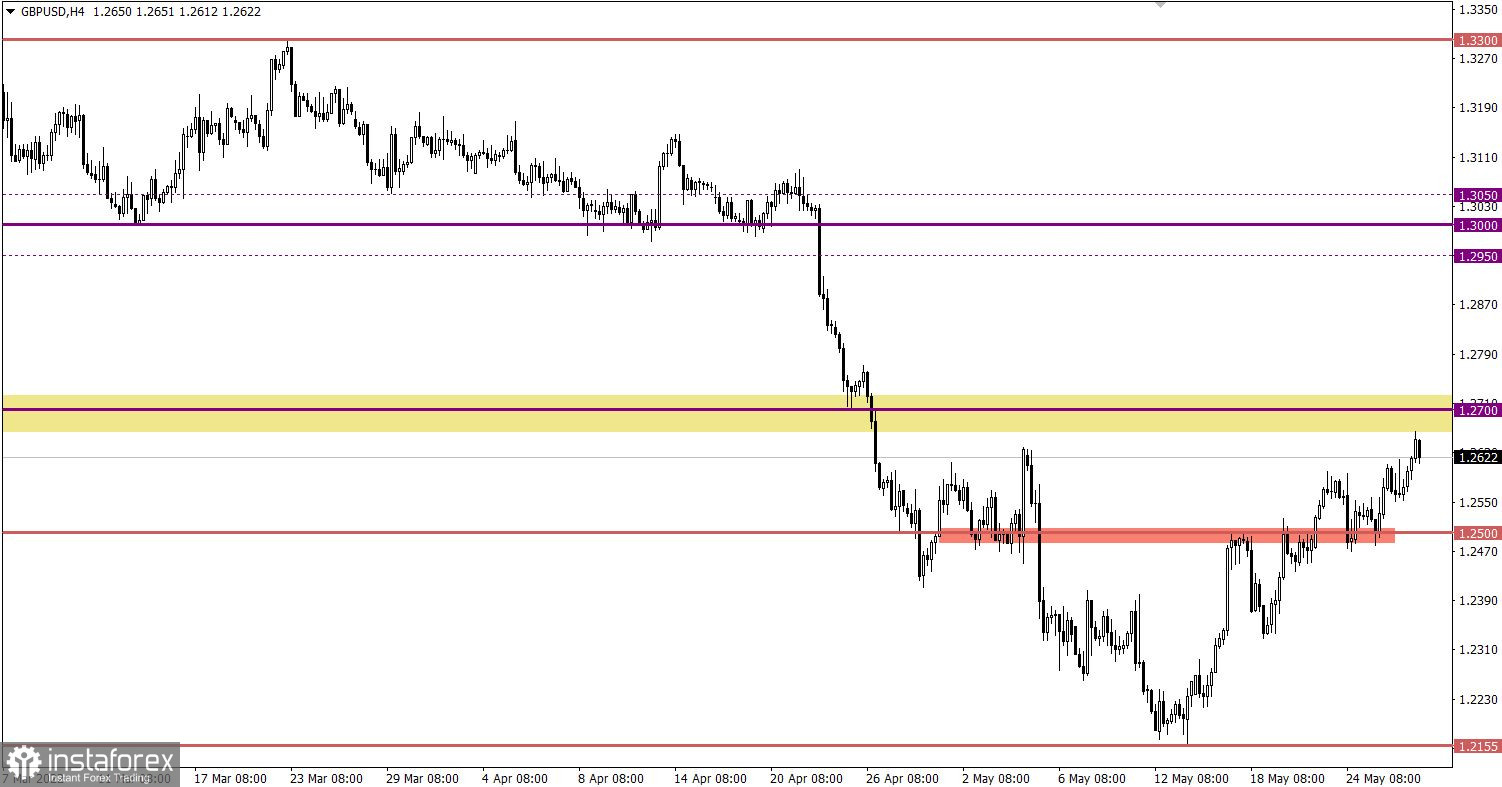
The GBPUSD currency pair, after a short stop at 1.2600, managed to prolong the corrective move. This led to a jump in activity on the part of buyers, where the pound sterling continued to strengthen.
Economic calendar for May 27
The trading week ends with an empty macroeconomic calendar. Publication of important statistics for Europe, Britain, and the United States is not expected.

Trading plan for EUR/USD on May 27
The euro has strengthened in value by more than 400 points in two weeks. This is a strong price change, which may soon lead to a slowdown and a change of trading interests. The price area of 1.0800/1.0850 is considered a resistance on the way of buyers.
Trading plan for GBP/USD on May 27
The correction cycle from the support level of 1.2155 has already led to quite strong price changes. The signal about the overbought pound is already brewing, but the rising interest has become speculative. Traders consider the 1.2670/1.2720 area as resistance. It is quite possible that there will be a reduction in the volume of long positions in these values, which will lead to a slowdown in the upward cycle.
An alternative scenario considers the subsequent formation of an elongated correction. This signal will be confirmed after the price holds above 1.2750 in the daily period.
What is reflected in the trading charts?
A candlestick chart view is graphical rectangles of white and black light, with sticks on top and bottom. When analyzing each candle in detail, you will see its characteristics of a relative period: the opening price, closing price, and maximum and minimum prices.
Horizontal levels are price coordinates, relative to which a stop or a price reversal may occur. These levels are called support and resistance in the market.
Circles and rectangles are highlighted examples where the price of the story unfolded. This color selection indicates horizontal lines that may put pressure on the quote in the future.
The up/down arrows are the reference points of the possible price direction in the future.