 English
  Русский
 Bahasa Indonesia
 Bahasa Malay
 ไทย
ไทย Español
 Deutsch
 Български
 Français
 Tiếng Việt
 中文
中文 বাংলা
বাংলা हिन्दी
 Čeština
 Українська
 Română

Trend analysis (Fig. 1).
The pound-dollar pair may move up from 1.2604 (close of yesterday's daily candle) to the historical resistance level at 1.2638 (blue dotted line). After testing this level, a downward pullback is possible with the target of 1.2590, the 14.6% retracement level (yellow dotted line). Upon reaching this level, the price may move up.
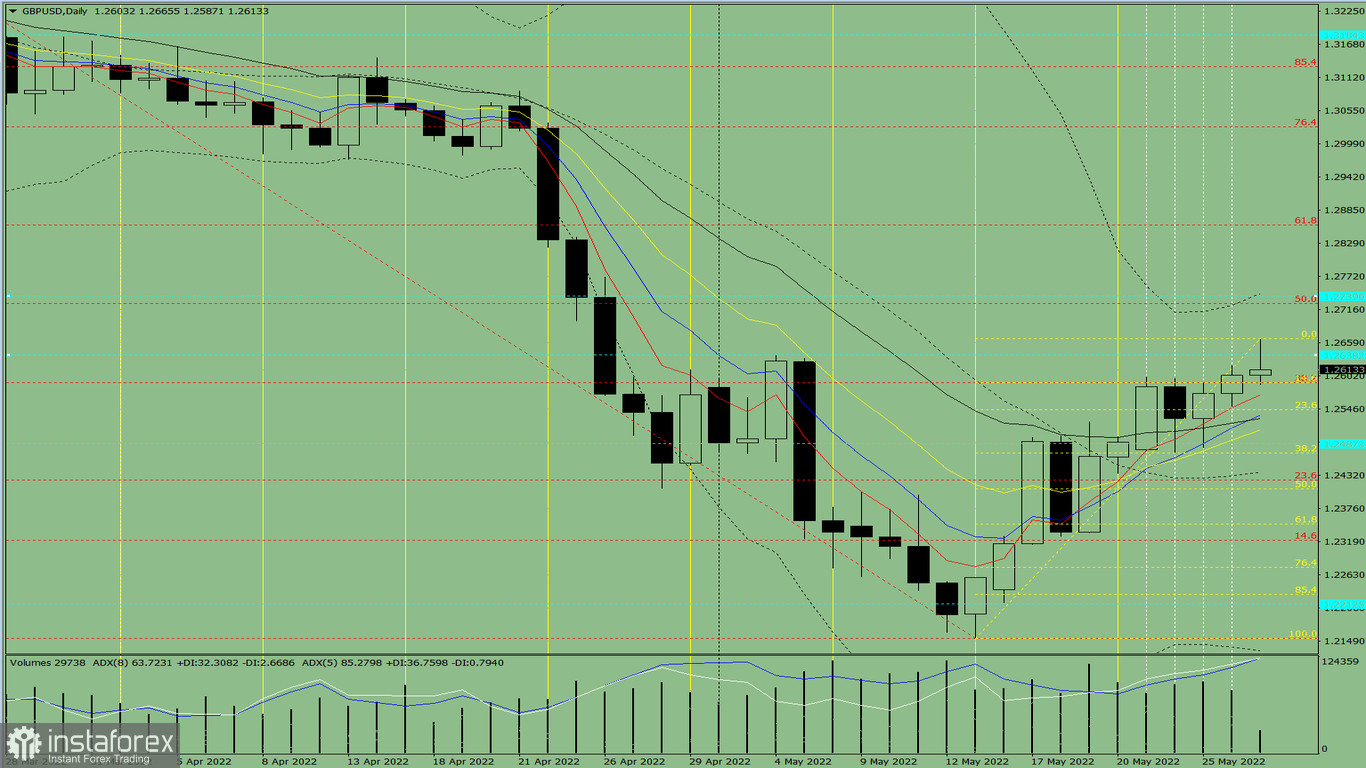
Fig. 1 (daily chart).
Comprehensive analysis:
- Indicator analysis – up;
- Fibonacci levels – up;
- Volumes – up;
- Candlestick analysis – up;
- Trend analysis – up;
- Bollinger bands – up;
- Weekly chart – up.
Today, the price may move upward from 1.2604 (close of yesterday's daily candle) to the historical resistance level at 1.2638 (blue dotted line). After testing this level, a downward pullback is possible with the target of 1.2590, the 14.6% retracement level (yellow dotted line). Upon reaching this level, the price may move up.
Alternative scenario: from the level of 1.2604 (close of yesterday's daily candle), the price may move upward to the historical resistance level at 1.2638 (blue dotted line). After testing this level, the price may move down with the target of 1.2544, the 23.6% retracement level (yellow dotted line). Upon reaching this level, the price may move up.