 English
  Русский
 Bahasa Indonesia
 Bahasa Malay
 ไทย
ไทย Español
 Deutsch
 Български
 Français
 Tiếng Việt
 中文
中文 বাংলা
বাংলা हिन्दी
 Čeština
 Українська
 Română

EUR/USD
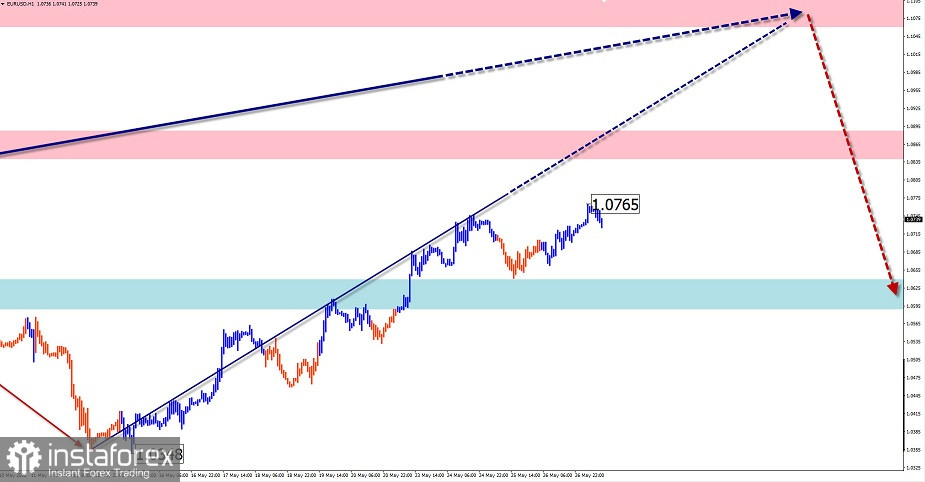
Analysis:The main European currency pair has been in a bearish downward trend since January 2021. From the strong potential reversal zone of the daily timeframe since May 13, the price has moved upwards, forming a correction of the last part of the main wave. The structure of the ascending section has not been completed so far. The middle part (B) is almost completed.
Outlook:In the coming week, it is expected that the upward movement vector will continue. At the beginning of the week, a short-term decline is possible, no further than the support zone. The most active phase of the upward movement is likely closer to the weekend. If the border of the nearest resistance fails to hold the rising price, the far resistance zone will be the benchmark for the completion of this wave. At the end of the week, a reversal formation and resumption of the bearish course can be expected.
Potential reversal zones
Resistance:- 1.1060/1.1110- 1.0840/1.0890
Support:- 1.0640/1.0590
Recommendations:There will be no conditions to sell the euro early next week. Intraday traders will have an opportunity to make short-term purchases with fractional lots. A conservative tactic would be to wait for the completion of the current wave and to sell after the appropriate signals appear on your trading systems.
USD/JPY
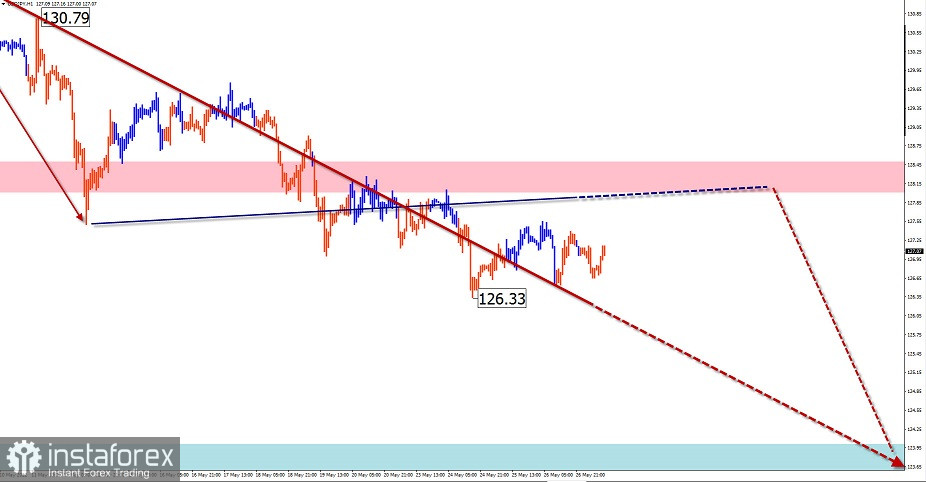
Analysis:The analysis of the dominant Japanese yen major upward wave from March 2020 suggests that this wave is complete. Its structure is fully formed. All parts of the wave have reached optimal proportions. The price is within the potential reversal zone of the large timeframe. The downward section from April 28 of this year has reversal potential.
Outlook:A continuation of the general downtrend is expected next week, with a predominantly flat nature of price movements. In the coming days there is a high probability of a price rally, up to the estimated resistance. From the middle of the week, we can expect a resumption of downward sentiment, with a gradual decline in the pair's rate to the support area.
Potential reversal zones
Resistance:- 128.00/128.50
Support:- 124.00/123.50
Recommendations:In the coming week, Japanese yen sellers could get active. The optimal entry zone for the trade is the estimated resistance. When opening short positions, it is worth considering the rather high probability of deep counter pullbacks.
GBP/JPY
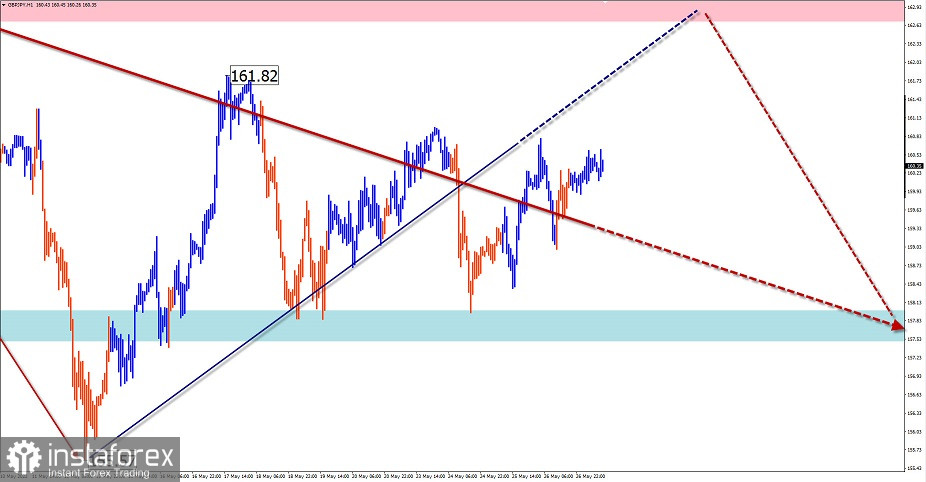
Analysis:The trend of the GBP/JPY cross pair has been pointing upwards for the last two years. Since mid-April, the price has been forming a correction, which has not been completed yet. Since May 12, the price has been moving up within the descending wave, forming the middle part (B). After its completion, the decline will continue.
Outlook:Over the next decade, the price is expected to move sideways, between the closest encounter zones. In the next couple of days, decrease in price is possible, up to the estimated support. A price hike to the upper boundary of the channel is likely by the end of the coming week. Thereafter, the probability of a reversal and a return to a bearish rate increases.
Potential reversal zones
Resistance:- 162.70/163.20
Support:- 158.00/157.50
Recommendations:Trading in the cross market in the near term can only be successful in individual sessions with a reduced lot. Before the end of the entire correction, opening short positions is more risky. The probability of deep counter pullbacks is high. It is optimal to refrain from trading for the time of formation of the whole current wave.
USD/CAD
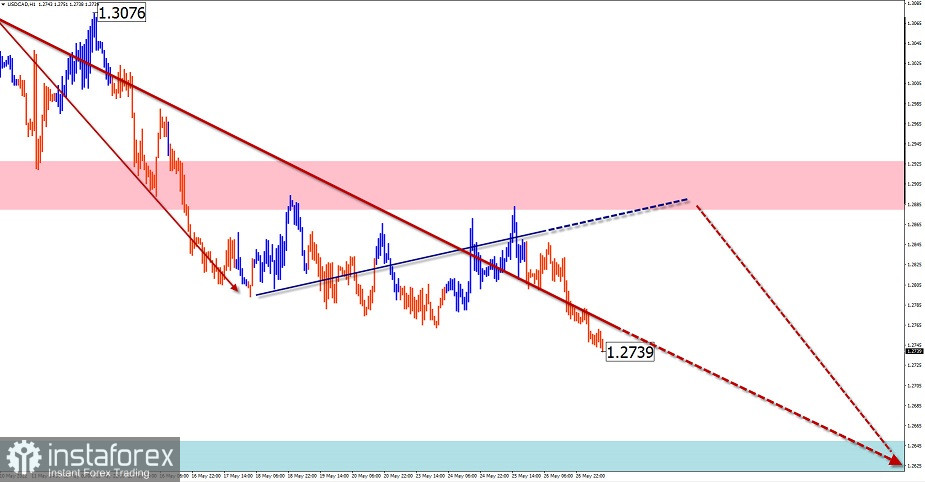
Analysis:The trend in the main Canadian dollar pair since March 2020 is directed to the south of the price chart. A counter-correction started a year ago. Analysis of the structure shows that it is missing a final stretch. Over the past 2 weeks, the price has been pulling back down, correcting the last bullish section. As the wave level forms and rises, it is possible that the move will turn into a correction of the entire current wave.
Outlook:During the coming week, the pair is expected to gradually decline from the resistance zone to the support area. Upward rebounds are more likely in the beginning of the week. The highest activity and price decline can be expected closer to the weekend.
Potential reversal zones
Resistance:- 1.2880/1.2930
Support:- 1.2650/1.2600
Recommendations:Opening long positions in the Canadian dollar market in the coming days is highly risky and could become unprofitable. It is better to reduce the lot. Selling the instrument from the resistance area is more promising. It is worth taking into account the temporary nature of the current decline.
GOLD
Analysis:The trend direction in the gold market since March this year is set by a downtrend wave. Within its framework, the price has been rising during the last two weeks, forming a temporary correction. After its completion, the price decline will continue.
Outlook:Gold prices may reach a resistance zone in the coming week. The second half of the coming week is expected to be more volatile. A reversal from the resistance zone and a return of the price to the support area is likely. A breakout of the lower support zone within the coming week is unlikely.
Potential reversal zones
Resistance:- 1890.0/1905.0
Support:- 1835.0/1820.0
Recommendations:Investments in gold in the coming days could yield profits if timing within individual sessions is followed and lot size is reduced. With a conservative trading style, it is better to refrain from trading the instrument until the end of the current upswing, with tracking signals to sell at the end of it.
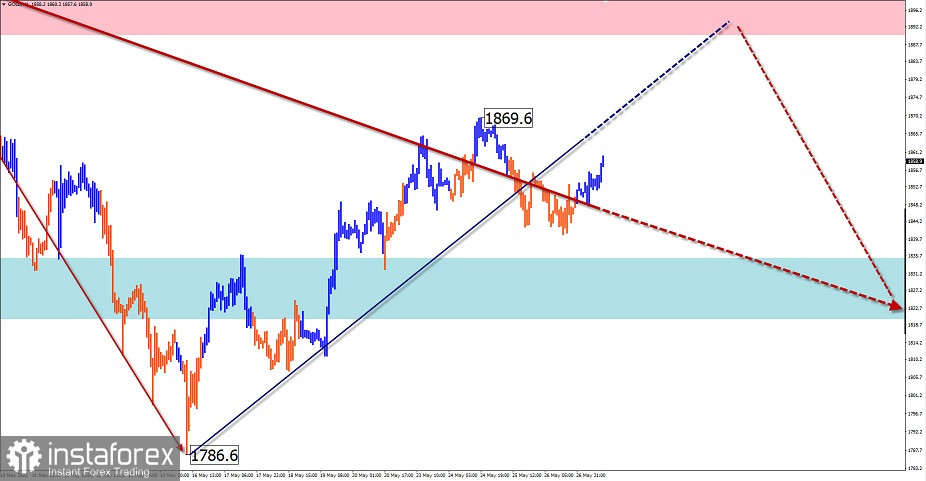
Explanation: In simplified wave analysis, all waves consist of 3 parts (A-B-C). Only the last, unfinished wave is analysed on each timeframe. The solid arrow background shows the structure formed. The dotted line shows the expected movement.
Attention: The wave algorithm does not take into account the duration of movements of the instruments over time!