 English
  Русский
 Bahasa Indonesia
 Bahasa Malay
 ไทย
ไทย Español
 Deutsch
 Български
 Français
 Tiếng Việt
 中文
中文 বাংলা
বাংলা हिन्दी
 Čeština
 Українська
 Română

As we noted in our Fundamental Analysis today, the US dollar is weakening, and the Canadian dollar is strengthening, also receiving support from rising oil prices.
Since June 2021, USD/CAD has been trying to fully restore the long-term trend, strengthening from lows near the 1.2000 mark, and repeatedly trying to break into the long-term bull market zone (above the key resistance level, EMA200 on the weekly USD/CAD chart).
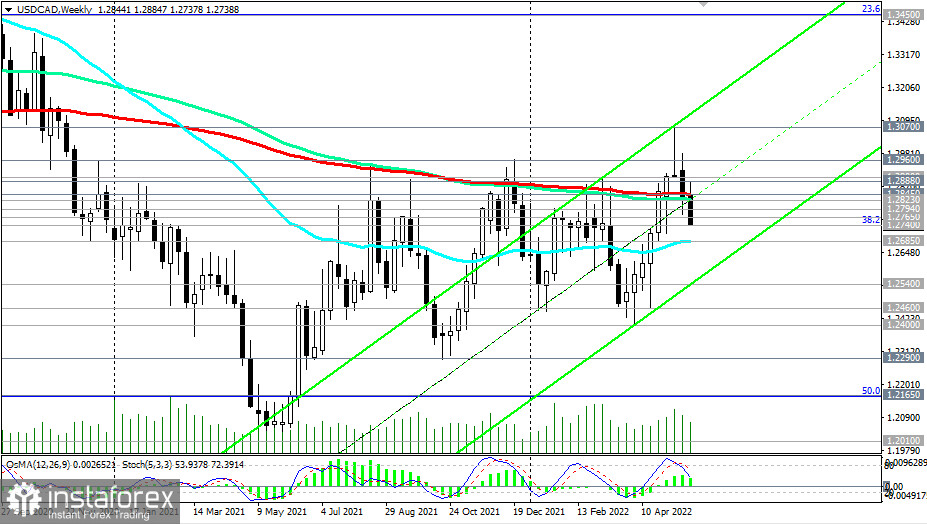
At the beginning of the month, it almost succeeded. The price broke through the resistance level of 1.2845 (EMA200 on the weekly chart) and was able to strengthen to 1.3070 (the maximum since December 2020).
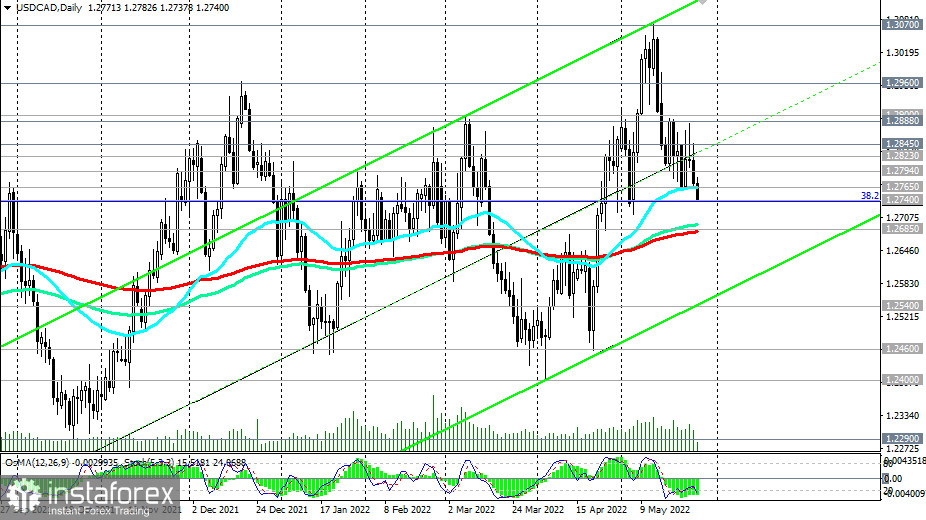
However, this week, USD/CAD has again fallen into the bear market zone, below the level of 1.2845. "USD/CAD is trading at the time of publication of this article near the 1.2740 mark, about 100 points below the opening price of this week and 30 points below the opening price of today."
A breakdown of the support levels of 1.2740 (the Fibonacci level of 38.2% of the downward correction in the wave of USD/CAD growth from 0.9700 to 1.4600), 1.2685 (EMA200 on the daily chart) will open the way for it towards the key support level of 1.2540 (EMA200 on the monthly chart), the breakdown of which will finally return USD/CAD to the long-term bear market zone.
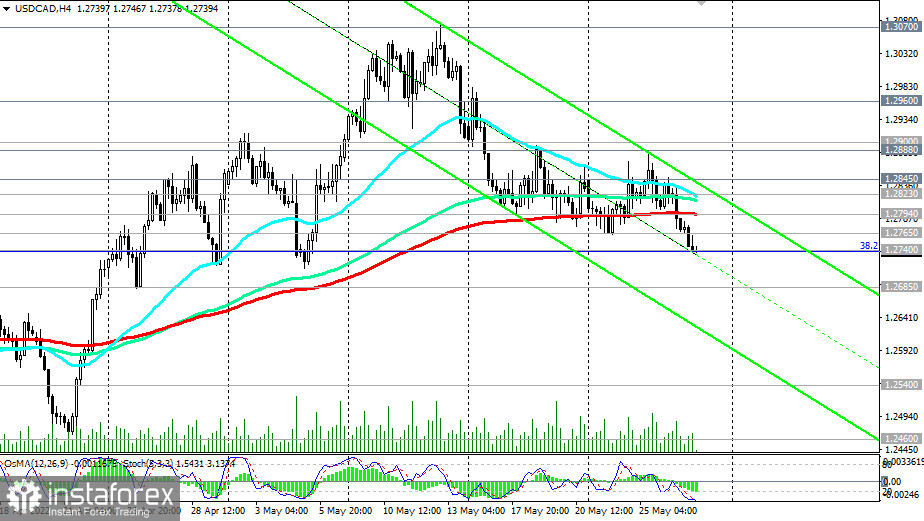
In an alternative scenario, the signal for purchases will be a breakdown of resistance levels 1.2765 (EMA50 on the daily chart), and 1.2794 (EMA200 on the 4-hour chart). And in this case, again, a new retest of the resistance level of 1.2845 is not excluded.
Thus, a high level of volatility remains in the pair, providing a lot of trading opportunities.
Support levels: 1.2740, 1.2700, 1.2685, 1.2600, 1.2540, 1.2460, 1.2400, 1.2290, 1.2165, 1.2010, 1.2000
Resistance levels: 1.2765, 1.2794, 1.2823, 1.2845, 1.2888, 1.2900, 1.2960, 1.3000, 1.3070, 1.3100
Trading Scenarios
Sell Stop 1.2725. Stop-Loss 1.2810. Take-Profit 1.2700, 1.2685, 1.2600, 1.2540, 1.2460, 1.2400, 1.2290, 1.2165, 1.2010, 1.2000
Buy Stop 1.2810. Stop-Loss 1.2725. Take-Profit 1.2823, 1.2845, 1.2888, 1.2900, 1.2960, 1.3000, 1.3070, 1.3100